
Numerical Integration (Trapezium Rule)
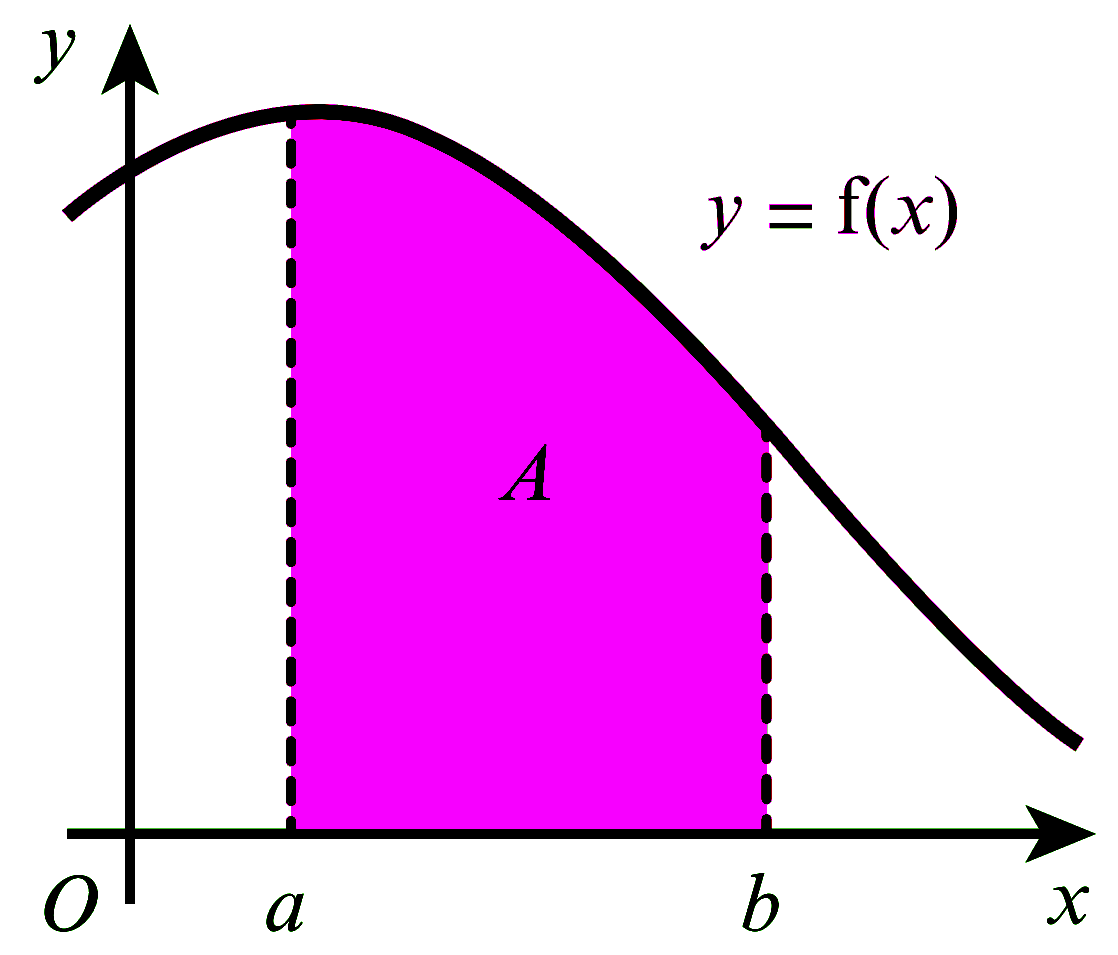
Curve တစ်ခု $y=f(x)$ အောက်ရှိ $a$ နှင့် $b$ ကြားပိုင်းအတွင်း area ကို $\displaystyle\int_{a}^{b} f(x) d x$ ဆိုတဲ့ integration နည်းလမ်းဖြင့် ရှာဖွေနိုင်ကြောင်း ကို ဒီ post မှာ ဖော်ပြခဲ့ပြီး ဖြစ်ပါတယ်။
သို့သော် integration method ကို သုံး၍ area ရှာဖွေရန် မလွယ်ကူသော function များစွာရှိပါတယ်။ ဒီလိုအခြေအနေမှာတော့ exact area ကို ရှာဖွေရန် မလွယ်ကူတော့ပဲ Numerical method ကို သုံးပြီး estimated area ကိုသာ ရှာဖွေနိုင်မှာ ဖြစ်ပါတယ်။ အဆိုပါ Estimated area ကိုရှာဖွေသည့်နည်းကို Trapezium Rule လို့ ခေါ်ပါတယ်။
Trapezium Rule ကို သုံးရန် အောက်ပါ အချက်များကို လုပ်ဆောင်ရမှာ ဖြစ်ပါတယ်။
- ပေးထားသော curve အောက်ရှိ area ရှာလိုသော ကြားပိုင်းအတွင်း အကျယ်တူညီသော ထောင်လိုက် အစိပ်အပိုင်းများ ပိုင်းဖြတ်ရပါမယ်။
- Trapezium တစ်ခုခြင်းစီ၏ area များအားလုံးပေါင်းခြင်း ဖြင့် လိုအပ်သော ဧရိယာ၏ ခန့်မှန်းတန်ဖိုးကို ရရှိမှာ ဖြစ်ပါတယ်။
- Trapezium ၏ area ကို ( $\dfrac{1}{2}$ × ပြိုင်သောအနားနှစ်ခုပေါင်းလဒ် × အကျယ်) ဖြင့်ရှာနိုင်ပါတယ်။
အောက်ပါပုံကို ဆက်လက်လေ့လာကြည့်ပါ။ Curve $y=f(x)$ အောက်ရှိ $a$ နှင့် $b$ ကြားပိုင်းအတွင်း area ကို ရှာရန်အတွက် အကျယ်တူညီသော ထောင်လိုက် အပိုင်း $6$ ပိုင်းပိုင်းထားပါတယ်။ ခန့်မှန်း ဧရိယာ = ထောင်လိုက် အပိုင်း $6$ ပိုင်း ဧရိယာများ ပေါင်းလဒ်ဟု အလွယ်တကူ သိနိုင်ပါတယ်။
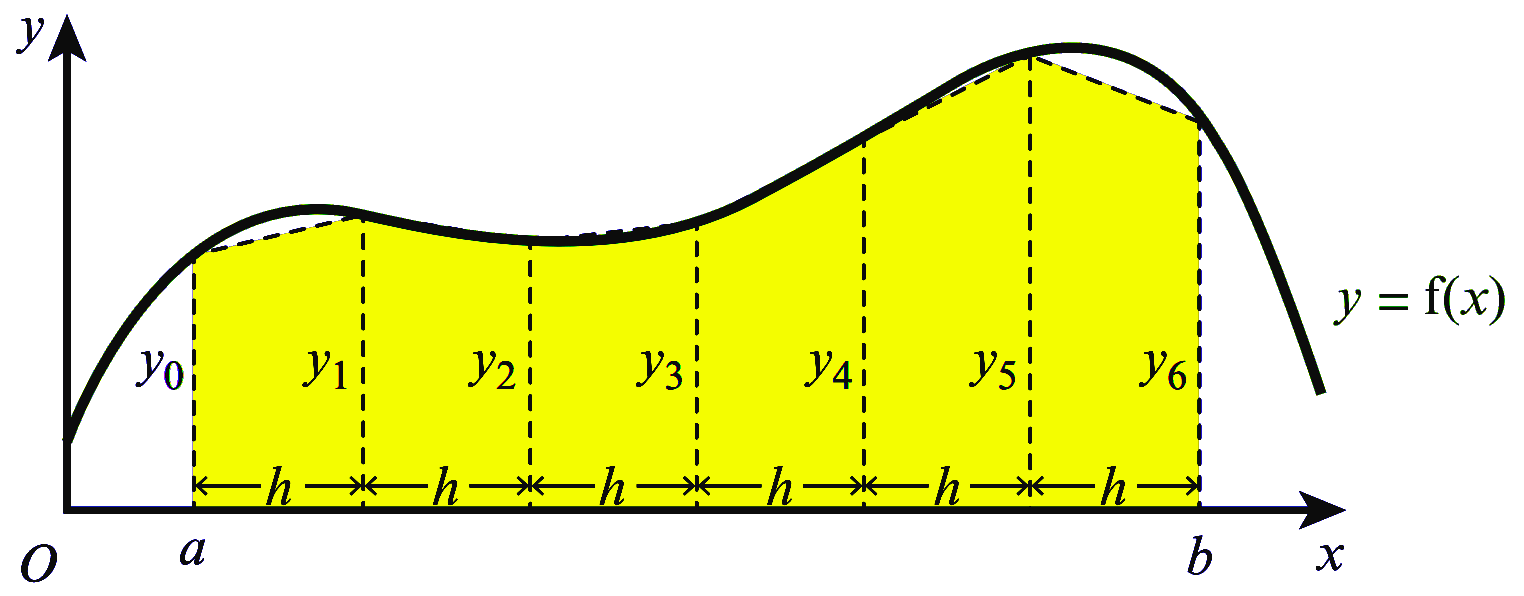
ကြားပိုင်း $a$ နှင့် $b$ ကြား အပိုင်း $6$ ပိုင်း, ပိုင်းထားရမှာ တစ်ပိုင်းစီ၏ အကျယ်ကို $h$ ဟုသတ်မှတ်ပါမယ်။ ဒါ့ကြောင့် $h$ ရဲ့ အလျားက $a$ နှင့် $b$ ကြား အကွာအဝေးကို $6$ နှင့်စားခြင်းဖြင့် ရရှိနိုင်မှာ ဖြစ်ပါတယ်။ $$ h = \dfrac{b-a}{6}$$ Trapezium တစ်ခုချင်းစီ၏ ဧရိယာကို အောက်ပါအတိုင်း ရှာယူနိုင်ပါတယ်။
| ပထမ Trapezium ၏ ဧရိယာ | $\dfrac{h}{2}\left(y_0+y_1\right)$ |
| ဒုတိယ Trapezium ၏ ဧရိယာ | $\dfrac{h}{2}\left(y_1+y_2\right)$ |
| တတိယ Trapezium ၏ ဧရိယာ | $\dfrac{h}{2}\left(y_2+y_3\right)$ |
| စတုတ္ထ Trapezium ၏ ဧရိယာ | $\dfrac{h}{2}\left(y_3+y_4\right)$ |
| ပဉ္စမ Trapezium ၏ ဧရိယာ | $\dfrac{h}{2}\left(y_4+y_5\right)$ |
| ဆဋ္ဌမ Trapezium ၏ ဧရိယာ | $\dfrac{h}{2}\left(y_5+y_6\right)$ |
ထို့ကြောင့် ဖော်ပြပါ ပုံ၏ သတ်မှတ်ထားသော ကြားပိုင်းအတွင်းရှိ ဧရိယာကို အောက်ပါအတိုင်း ရှာယူနိုင်ပါတယ်။
|
$\begin{aligned}
\text{Estimated Area } &= \dfrac{h}{2}\left(y_0+y_1+y_1+y_2+y_2+y_3+y_3+y_4+y_4+y_5+y_5+y_6\right)\\\\
&= \dfrac{h}{2}\left[\left(y_0+y_6+ 2(y_1+y_2+y_3+y_4+y_5\right)\right]\\\\
\text{where } h = \dfrac{b-a}{6}&
\end{aligned}$ |
|---|

အကယ်၍ သတ်မှတ်ကြားပိုင်း $a$ နှင့် $b$ အတွင်း ထောင်လိုက် အစိပ်အပိုင်း $n$ ခု ပိုင်းဖြတ်ထားသည် ဆိုပါစို့။ ထိုအခါ အပိုင်း တစ်ခု၏ အကျယ်မှာ $$h = \dfrac{b-a}{n}$$ ဖြစ်မည်။ ထိုအခါ ခန့်မှန်း ဧရိယာ၏ တန်းဖိုးမှာ
| $$A \approx \dfrac{h}{2}\left[\left(y_0+y_n+ 2(y_1+y_2+y_3+\ldots+y_{n-1}+y_n\right)\right]\\\\$$ |
|---|
ဆိုသော ပုံသေနည်း ဖြင့်ရှာယူနိုင်မည်။
| Numerical Integration (Trapezium Rule) |
|
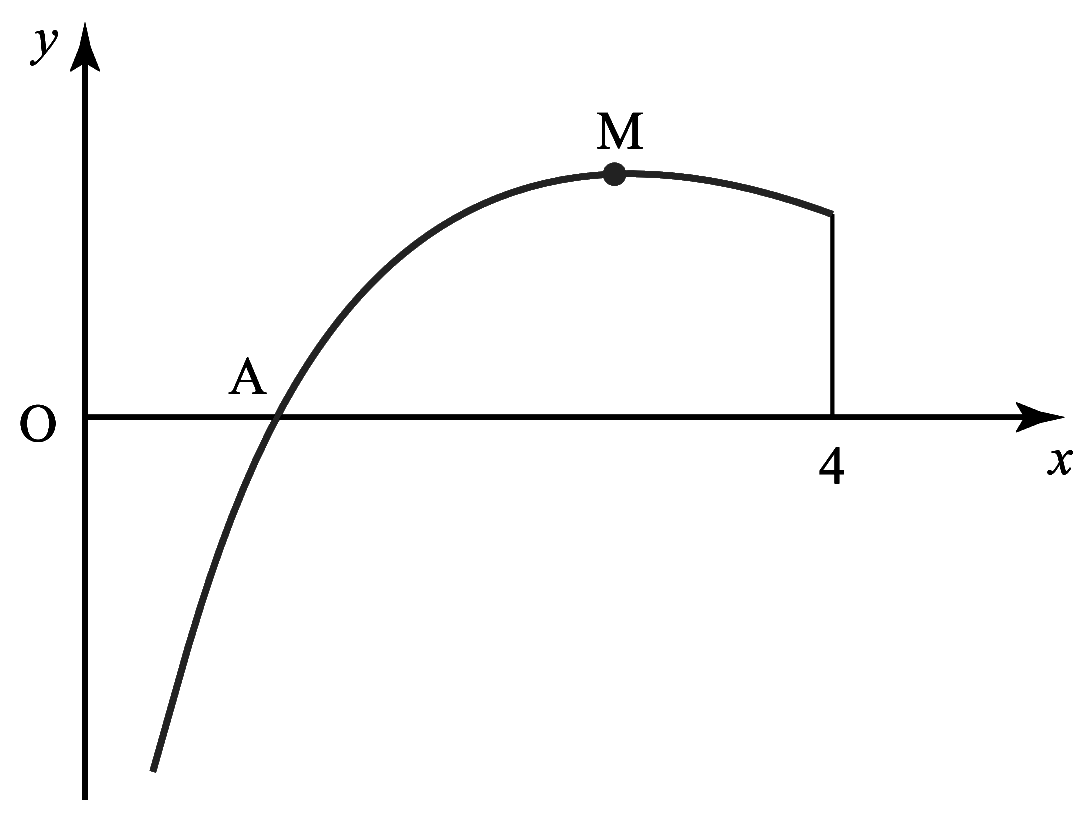
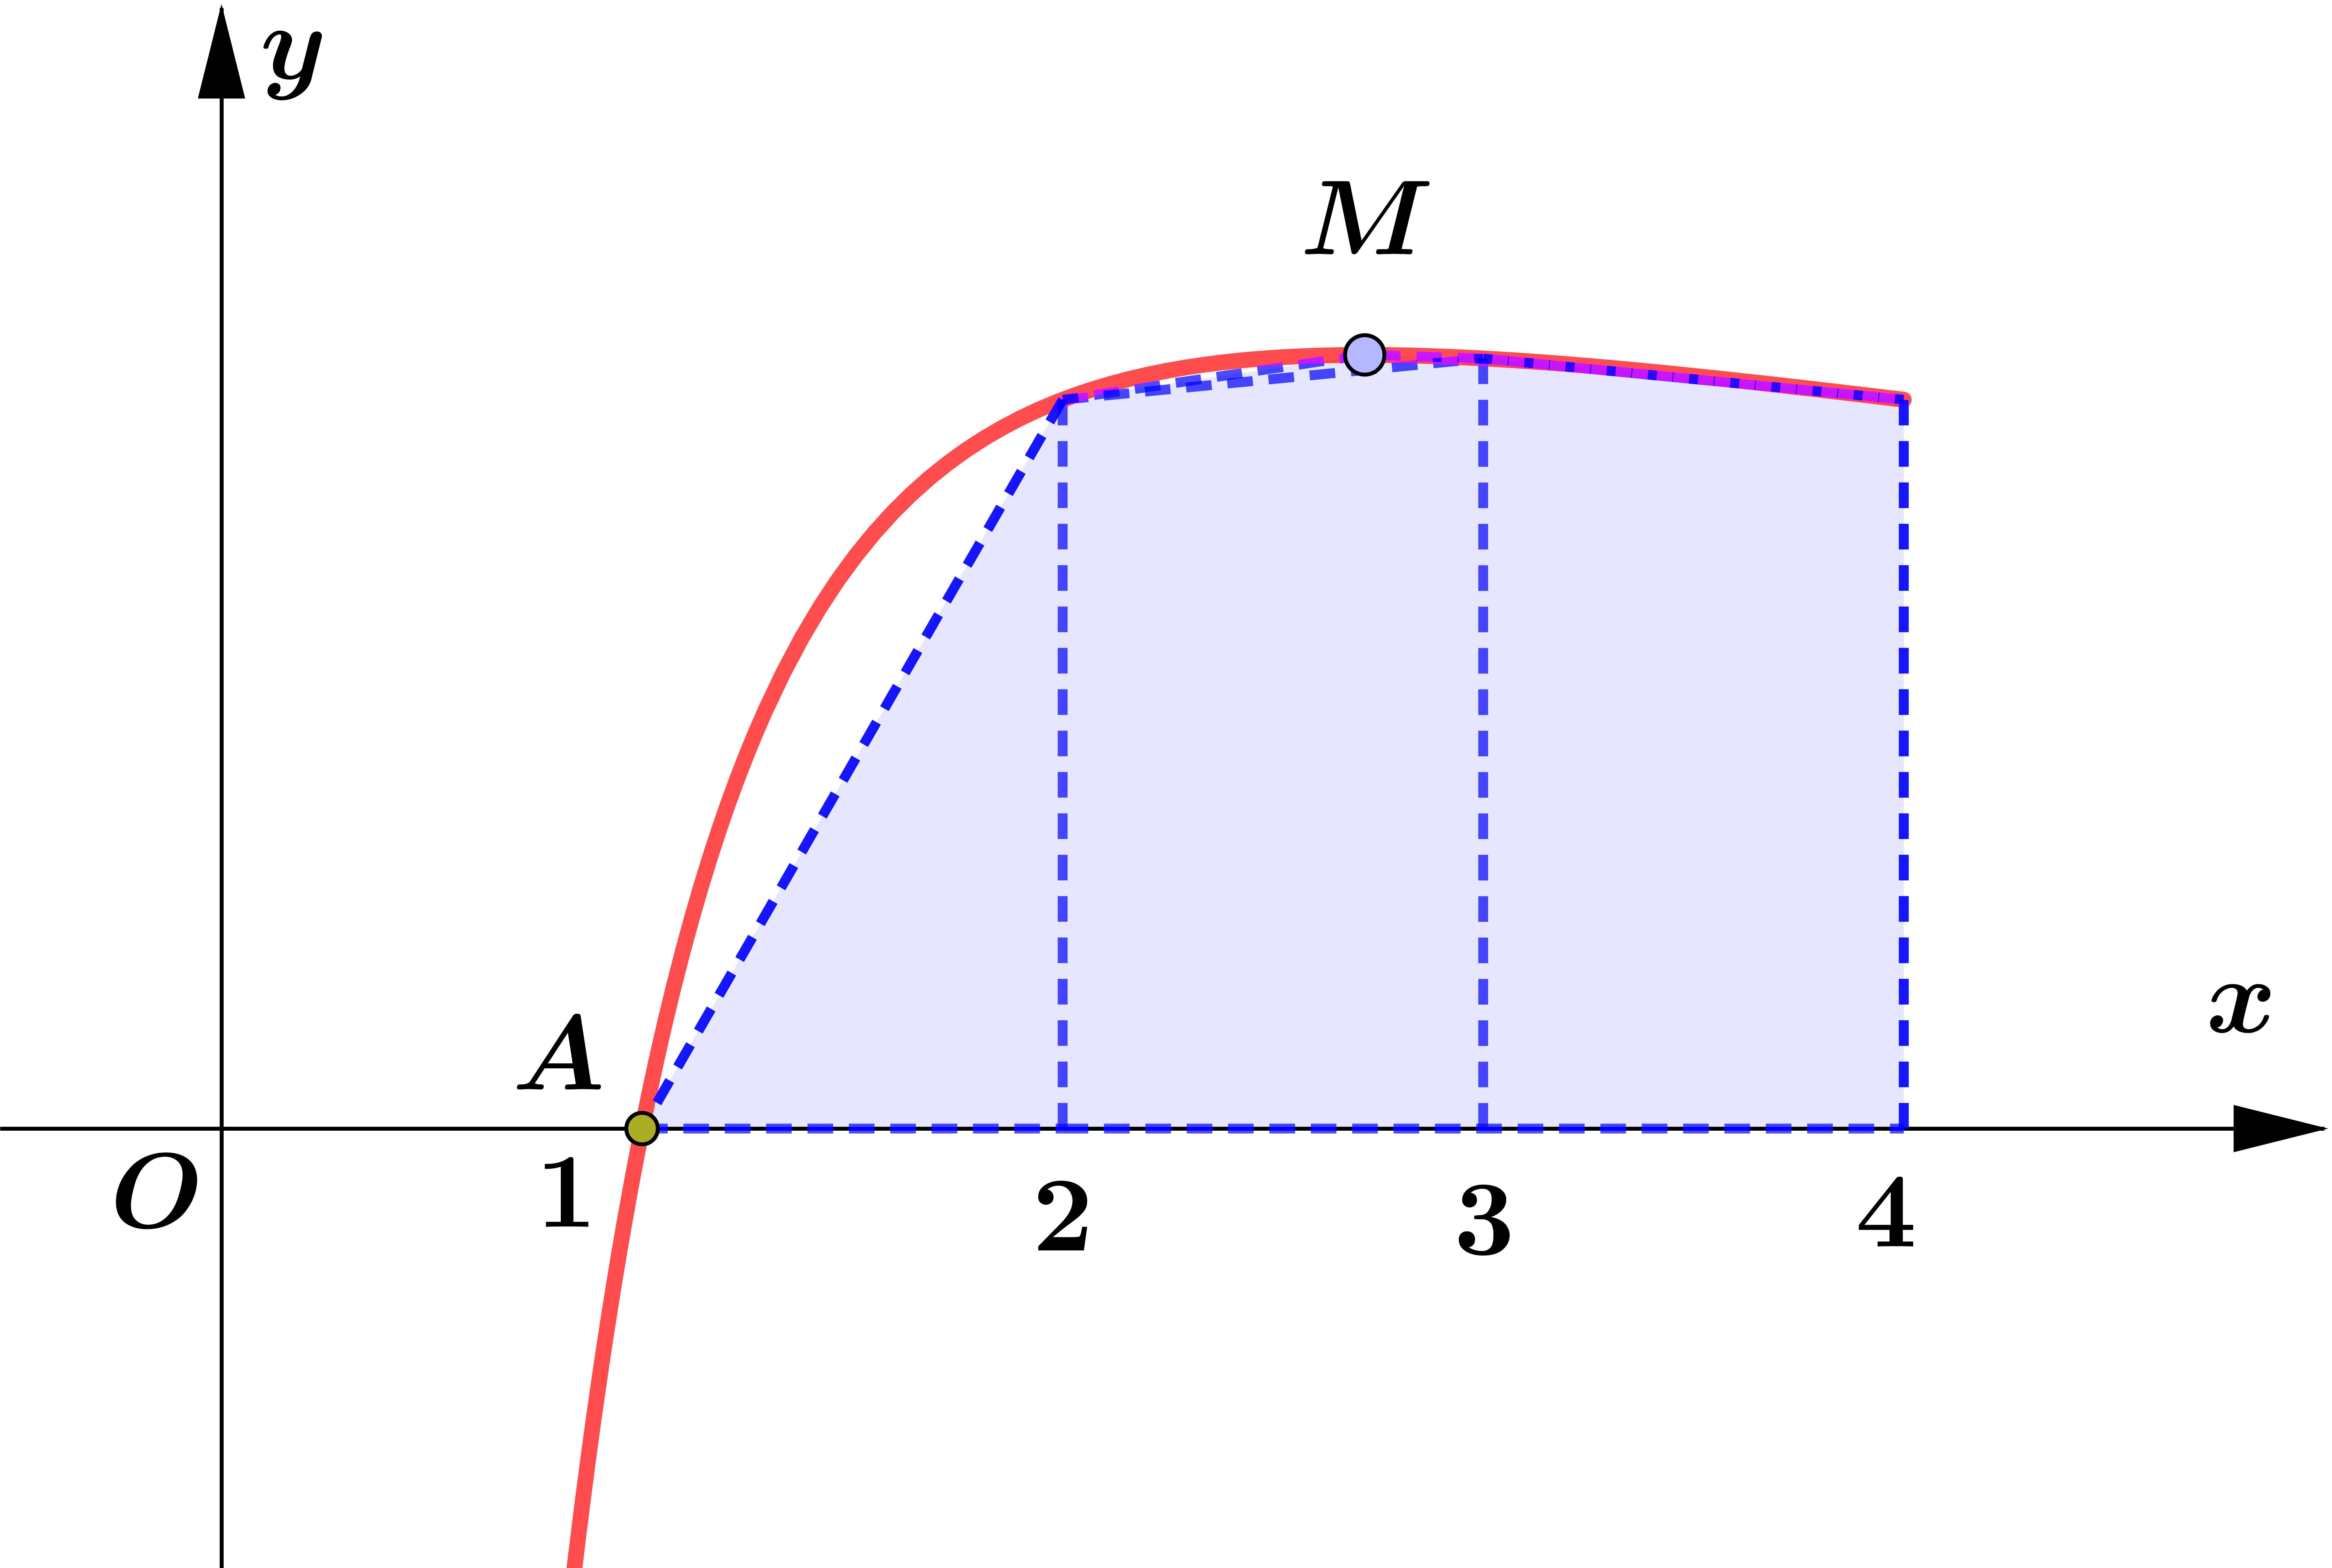
$\displaystyle\int_{a}^{b} f(x) dx \approx \dfrac{h}{2}\left[y_{0}+y_{n}+2\left(y_{1}+y_{2}+y_{3}+\ldots+y_{n-1}\right)\right]$ where $h=\dfrac{b-a}{n}. $ အလွယ်မှတ်ရန် $\displaystyle\int_{a}^{b} f(x)dx \approx$ half width of strip $\times$ (first $+$ last $+$ twice the sum of all the others). အကယ်၍ Trapezium များသည် Curve ၏ အပေါ်သို့ ကျော်နေပါက estimated area သည် အမှန်ရှိသော တန်ဖိုးထက် ကြီးနေပြီး ၎င်းအခြေအနေကို over estimate ဟုခေါ်သည်။ Fig (1) ကို ကြည့်ပါ။ 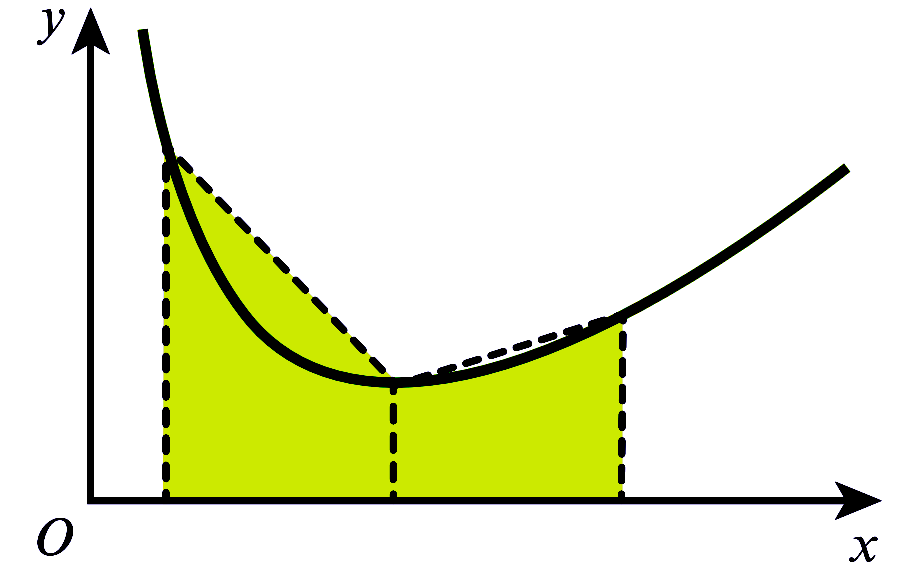
အကယ်၍ Trapezium များသည် Curve ၏ အောက်တွင်သာ ရှိပါက estimated area သည် အမှန်ရှိသော တန်ဖိုးအောက် ငယ်နေပြီး ၎င်းအခြေအနေကို under estimate ဟုခေါ်သည်။ Fig (2) ကို ကြည့်ပါ။ 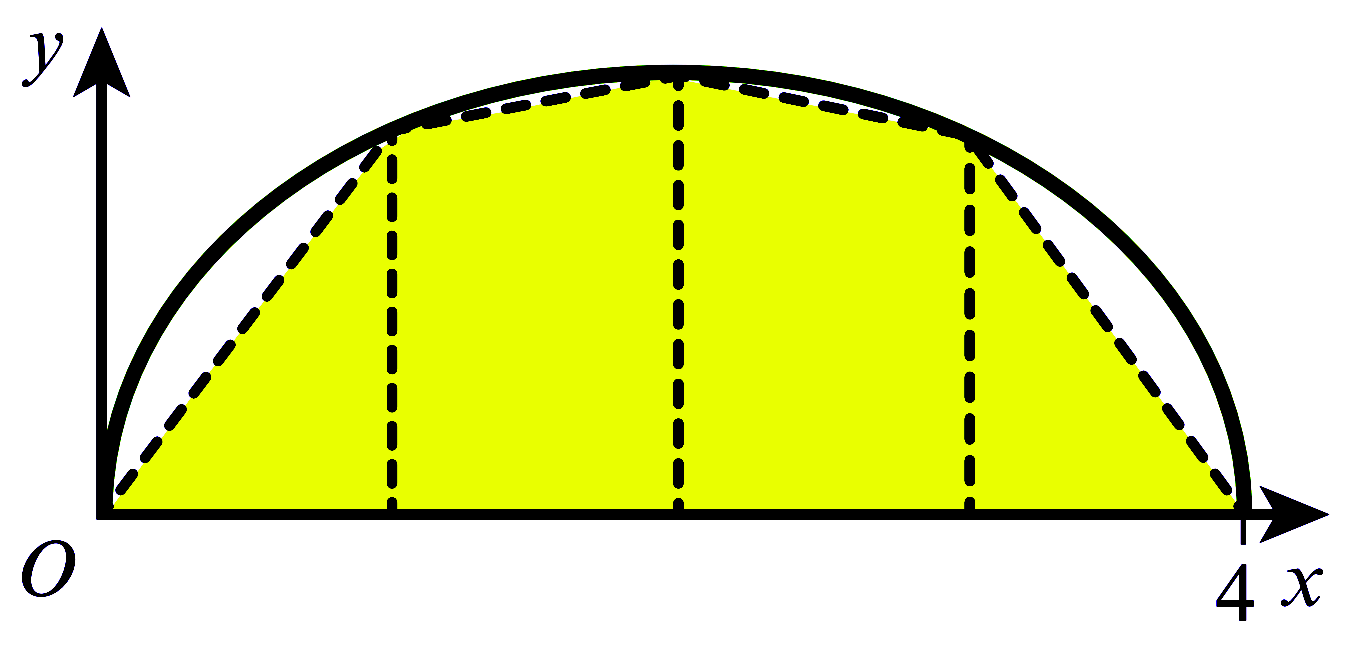
|
ဆက်လက်၍ trapezium rule ကို အသုံးပြုသည့် numerical integration ဆိုင်ရာ ပုစ္ဆာများကို တင်ပြပါမည်။
| Example (1) |
|
|
| Example (2) |
|
Use the trapezium rule with three intervals to find an approximation to $\displaystyle\int_{1}^{4} \frac{6}{1+\sqrt{x}}dx$. Give your answer correct to $5$ significant figures. SolutionLet $y=\dfrac{6}{1+\sqrt{x}}$ For $\displaystyle\int_{1}^{4} y d x$, $\begin{aligned} &\\ a &=1, b=4, n=3 \text { (given) } \\\\ \therefore \quad h &=\frac{b-a}{n} \\\\ &=\frac{4-1}{3} \\\\ &=1\\\\ \end{aligned}$ $\begin{array}{|c||c|c|c|c|} \hline x & 1 & 2 & 3 & 4 \\ \hline y & 3 & 2.4853 & 2.1962 & 2 \\ \hline \end{array}$ $\begin{aligned} & \displaystyle\int_{1}^{4} \frac{6}{1+\sqrt{x}} d x \\\\ \approx&\ \frac{1}{2}[(3+2)+2(2.4853+2.1962)] \\\\ =&\ 7.1815 \end{aligned}$ |
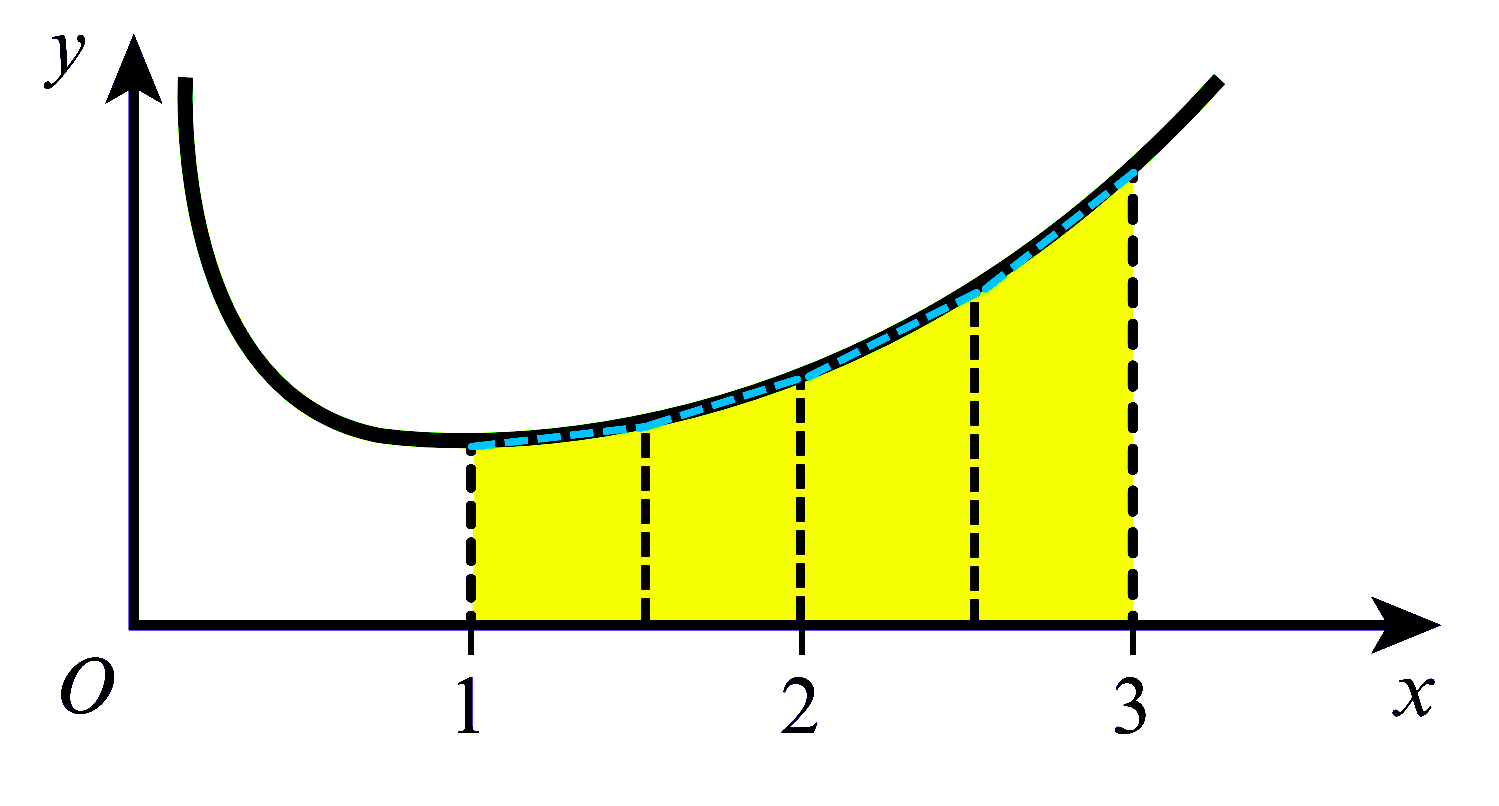
| Example (3) |
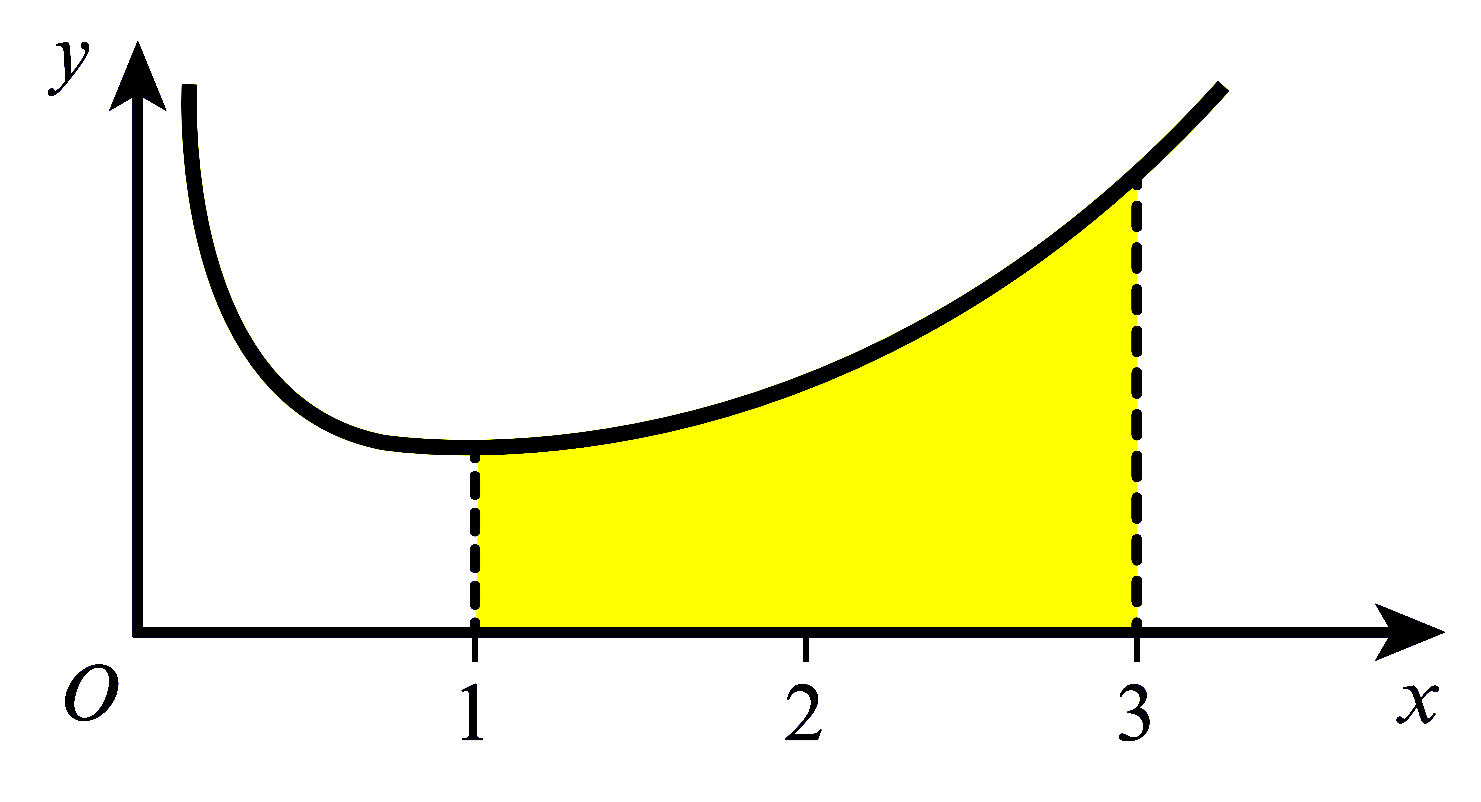
The diagram shows part of the curve $y=\dfrac{\mathrm{e}^{x}}{2 x}$. Use the trapezium rule with 4 intervals to
estimate the area of the shaded region, giving your answer correct to 2 decimal places.
State, with a reason, whether the trapezium rule gives an under-estimate or an over-estimate of the true value
of the shaded area. |
إرسال تعليق