
-
The graph below shows the curve with equation \(\displaystyle y=\sin 2 x\) in the interval \(\displaystyle -60^{\circ} \leq x \leq 270^{\circ}\).
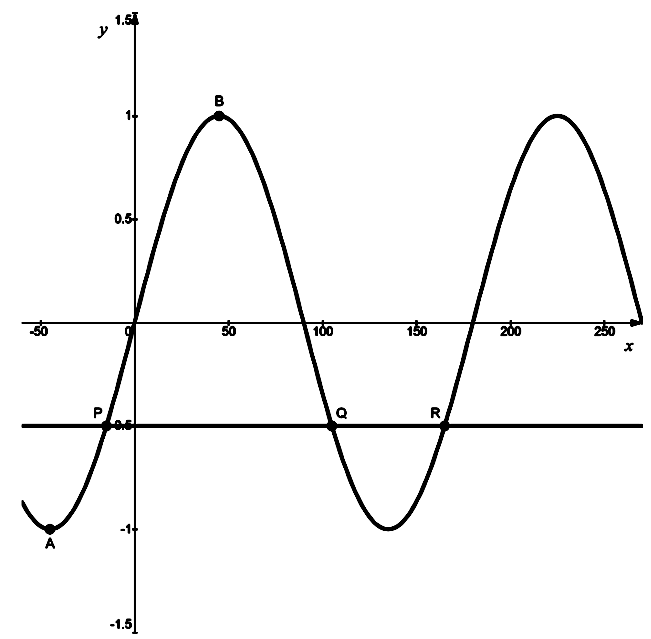
- Point \(\displaystyle A\) has coordinates \(\displaystyle \left(-45^{\circ},-1\right)\) and is the minimum point closest to the origin. Point \(\displaystyle B\) is the maximum point closest to the origin. State the coordinates of \(\displaystyle B\).
- A straight line with equation \(\displaystyle y=-\frac{1}{2}\) meets the graph of \(\displaystyle y=\sin 2 x\) at the three points \(\displaystyle P, Q\) and \(\displaystyle R\), as shown in the diagram. Given that point \(\displaystyle P\) has coordinates \(\displaystyle \left(-15^{\circ},-\frac{1}{2}\right)\), use graph symmetries to determine the coordinates of \(\displaystyle Q\) and \(\displaystyle R\).
\(\displaystyle \begin{aligned} \textbf{(a)} \quad & \text{For } y = \sin 2x \text{, the maximum value is } 1. \\[2mm] & \sin 2x = 1 \implies 2x = 90^{\circ} \implies x = 45^{\circ} \\[2mm] & \text{The maximum point closest to the origin is } B(45^{\circ}, 1). \\[2mm] \textbf{(b)} \quad & \text{The line } y = -0.5 \text{ intersects the curve.} \\[2mm] & \text{The period of } y = \sin 2x \text{ is } \frac{360^{\circ}}{2} = 180^{\circ}. \\[2mm] & \text{Point } R \text{ is exactly one period away from } P(-15^{\circ}, -0.5). \\[2mm] & x_R = -15^{\circ} + 180^{\circ} = 165^{\circ} \implies R(165^{\circ}, -0.5). \\[2mm] & \text{By symmetry, the roots are at } 0^{\circ}, 90^{\circ}, 180^{\circ}. \\[2mm] & \text{Distance from root } 0^{\circ} \text{ to } P \text{ is } 15^{\circ}. \\[2mm] & \text{By symmetry around the root } 90^{\circ} \text{, point } Q \text{ is } 15^{\circ} \text{ after } 90^{\circ}. \\[2mm] & x_Q = 90^{\circ} + 15^{\circ} = 105^{\circ} \implies Q(105^{\circ}, -0.5). \end{aligned} \) -
The height of a ball bouncing on a spring can be modelled in time by the equation \(\displaystyle h=6 \sin \left(\frac{2 \pi}{7} t\right)\) where \(\displaystyle h\) is the height and \(\displaystyle t\) is time in second:
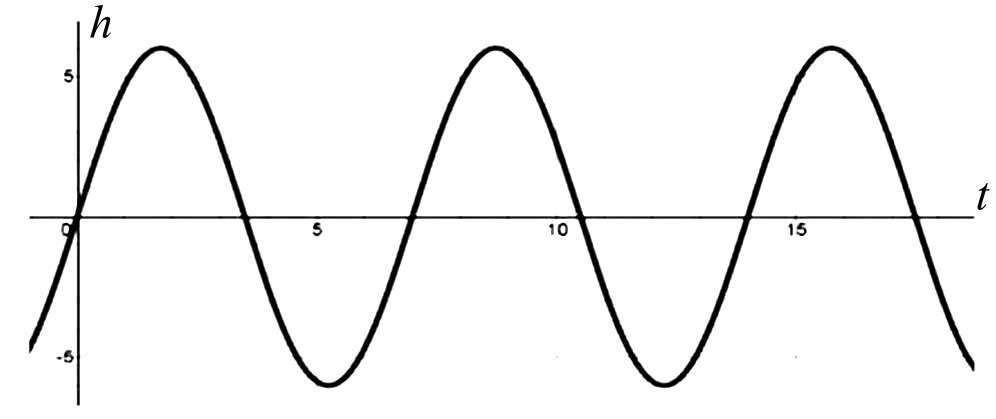
- What is the Amplitude of the balls bounce?
- How long does it take the ball to go from the peak down to the bottom and return to the peak?
- From the equilibrium how many seconds does it take the ball to reach a height of \(\displaystyle 4 \mathrm{~cm}\)?
\(\displaystyle \begin{aligned} \textbf{(a)} \quad & \text{Amplitude } = 6 \text{ cm} \\[2mm] \textbf{(b)} \quad & \text{Time from peak to bottom and back to peak is one full period.} \\[2mm] & \text{Period } T = \frac{2\pi}{\left(\frac{2\pi}{7}\right)} = 7 \text{ seconds.} \\[2mm] \textbf{(c)} \quad & h = 6 \sin \left(\frac{2 \pi}{7} t\right) \\[2mm] & 6 \sin \left(\frac{2 \pi}{7} t\right) = 4 \\[2mm] & \sin \left(\frac{2 \pi}{7} t\right) = \frac{4}{6} = \frac{2}{3} \\[2mm] & \frac{2 \pi}{7} t = \sin^{-1}\left(\frac{2}{3}\right) \approx 0.7297 \text{ radians} \\[2mm] & t = 0.7297 \times \frac{7}{2\pi} \approx 0.813 \text{ seconds.} \end{aligned} \) -
.jpg)
The diagram shows part of the graph of \(\displaystyle y=a \tan (x-b)+c\). Given that \(\displaystyle 0 < b < \pi\), state the values of the constants \(\displaystyle a, b\) and \(\displaystyle c\).
\(\displaystyle \begin{aligned} & \text{From the graph, the asymptotes are at } x = \frac{3\pi}{4} \text{ and } x = \frac{7\pi}{4}. \\[2mm] & \text{The standard } y = \tan x \text{ has asymptotes at } \pm \frac{\pi}{2}. \\[2mm] & \text{Shift: } \frac{\pi}{2} + b = \frac{3\pi}{4} \implies b = \frac{\pi}{4}. \\[2mm] & \text{Let } b = \frac{\pi}{4}. \text{ The equation becomes } y = a \tan \left(x - \frac{\pi}{4}\right) + c. \\[2mm] & \text{At } x = \frac{\pi}{4} \text{, the graph shows } y = 1. \\[2mm] & 1 = a \tan(0) + c \implies c = 1. \\[2mm] & \text{At } x = \frac{\pi}{2} \text{, the graph shows } y = 3. \\[2mm] & 3 = a \tan\left(\frac{\pi}{2} - \frac{\pi}{4}\right) + 1 \implies 3 = a \tan\left(\frac{\pi}{4}\right) + 1 \\[2mm] & 3 = a(1) + 1 \implies a = 2. \\[2mm] & \therefore \quad a = 2, \quad b = \frac{\pi}{4}, \quad c = 1. \end{aligned} \) -
.jpg)
The diagram shows part of the curve with equation \(\displaystyle y=p \sin (q \theta)+r\), where \(\displaystyle p, q\) and \(\displaystyle r\) are constants.
- State the value of \(\displaystyle p\).
- State the value of \(\displaystyle q\).
- State the value of \(\displaystyle r\).
\(\displaystyle \begin{aligned} & \text{Maximum value } = 1, \quad \text{Minimum value } = -5. \\[2mm] \textbf{(a)} \quad & \text{Amplitude } p = \frac{\text{Max} - \text{Min}}{2} = \frac{1 - (-5)}{2} = \frac{6}{2} = 3. \\[2mm] \textbf{(b)} \quad & \text{From peak } (\pi, 1) \text{ to trough } (3\pi, -5) \text{ is half a period.} \\[2mm] & \frac{T}{2} = 3\pi - \pi = 2\pi \implies \text{Period } T = 4\pi. \\[2mm] & q = \frac{2\pi}{T} = \frac{2\pi}{4\pi} = \frac{1}{2}. \\[2mm] \textbf{(c)} \quad & \text{Vertical shift } r = \frac{\text{Max} + \text{Min}}{2} = \frac{1 + (-5)}{2} = \frac{-4}{2} = -2. \end{aligned} \) -
Solve, by factorizing, the equation
\(\displaystyle 6 \cos \theta \tan \theta-3 \cos \theta+4 \tan \theta-2=0,\)
for \(\displaystyle 0^{\circ} \leqslant \theta \leqslant 180^{\circ}\).
The diagram shows part of the graph of \(\displaystyle y=a \cos (b x)+c\).
.jpg)
- Find the values of the positive integers \(\displaystyle a, b\) and \(\displaystyle c\).
- For these values of \(\displaystyle a, b\) and \(\displaystyle c\), use the given diagram to determine the number of solutions in the interval \(\displaystyle 0 \leqslant x \leqslant 2 \pi\) for each of the following equations.
- \(\displaystyle a \cos (b x)+c=\frac{6}{\pi} x\)
- \(\displaystyle a \cos (b x)+c=6-\frac{6}{\pi} x\)
\(\displaystyle \begin{aligned} & 6 \cos \theta \tan \theta - 3 \cos \theta + 4 \tan \theta - 2 = 0 \\[2mm] & 3 \cos \theta (2 \tan \theta - 1) + 2 (2 \tan \theta - 1) = 0 \\[2mm] & (3 \cos \theta + 2)(2 \tan \theta - 1) = 0 \\[2mm] & \cos \theta = -\frac{2}{3} \quad \text{or} \quad \tan \theta = \frac{1}{2} \\[2mm] & \text{Since } 0^{\circ} \leqslant \theta \leqslant 180^{\circ}: \\[2mm] & \text{For } \cos \theta = -0.6667 \implies \theta = 180^{\circ} - 48.2^{\circ} = 131.8^{\circ} \\[2mm] & \text{For } \tan \theta = 0.5 \implies \theta = 26.6^{\circ} \\[2mm] & \therefore \quad \theta = 26.6^{\circ}, \quad 131.8^{\circ} \\[2mm] & \hrulefill \\[2mm] \textbf{(a)} \quad & \text{Maximum value } = 8, \quad \text{Minimum value } = -2. \\[2mm] & a = \frac{8 - (-2)}{2} = \frac{10}{2} = 5. \\[2mm] & c = \frac{8 + (-2)}{2} = \frac{6}{2} = 3. \\[2mm] & \text{From the graph, one full cycle completes at } x = \pi. \\[2mm] & \text{Period } = \pi \implies \frac{2\pi}{b} = \pi \implies b = 2. \\[2mm] & \therefore \quad a = 5, \quad b = 2, \quad c = 3. \\[2mm] \textbf{(b)(i)} \quad & 5 \cos(2x) + 3 = \frac{6}{\pi} x \\[2mm] & \text{Draw the line } y = \frac{6}{\pi} x \text{ on the graph.} \\[2mm] & \text{Points on line: } (0, 0), (\pi, 6), (2\pi, 12). \\[2mm] & \text{The line intersects the curve exactly } 3 \text{ times.} \\[2mm] & \text{Number of solutions } = 3. \\[2mm] \textbf{(b)(ii)} \quad & 5 \cos(2x) + 3 = 6 - \frac{6}{\pi} x \\[2mm] & \text{Draw the line } y = 6 - \frac{6}{\pi} x \text{ on the graph.} \\[2mm] & \text{Points on line: } (0, 6), (\pi, 0), (2\pi, -6). \\[2mm] & \text{The line intersects the curve exactly } 2 \text{ times.} \\[2mm] & \text{Number of solutions } = 2. \end{aligned} \) -
.jpg)
The diagram shows the graph of \(\displaystyle y=f(x)\), where \(\displaystyle f(x)=\frac{3}{2} \cos 2 x+\frac{1}{2}\) for \(\displaystyle 0 \leqslant x \leqslant \pi\).
- State the range of \(\displaystyle f\).
A function \(\displaystyle g\) is such that \(\displaystyle g(x)=f(x)+k\), where \(\displaystyle k\) is a positive constant. The \(\displaystyle x\)-axis is a tangent to the curve \(\displaystyle y=g(x)\).
- State the value of \(\displaystyle k\) and hence describe fully the transformation that maps the curve \(\displaystyle y=f(x)\) on to \(\displaystyle y=g(x)\)
- State the equation of the curve which is the reflection of \(\displaystyle y=f(x)\) in the \(\displaystyle x\)-axis. Give your answer in the form \(\displaystyle y=a \cos 2 x+b\), where \(\displaystyle a\) and \(\displaystyle b\) are constants.
\(\displaystyle \begin{aligned} \textbf{(a)} \quad & \text{Maximum of } f(x) = \frac{3}{2}(1) + \frac{1}{2} = 2 \\[2mm] & \text{Minimum of } f(x) = \frac{3}{2}(-1) + \frac{1}{2} = -1 \\[2mm] & \text{Range: } -1 \leqslant f(x) \leqslant 2 \\[2mm] \textbf{(b)} \quad & g(x) = f(x) + k \\[2mm] & \text{The } x\text{-axis is tangent to } g(x) \implies \text{Minimum of } g(x) = 0. \\[2mm] & \text{Min of } f(x) + k = 0 \implies -1 + k = 0 \implies k = 1. \\[2mm] & \text{Transformation: Translation by vector } \begin{pmatrix} 0 \\ 1 \end{pmatrix}. \\[2mm] \textbf{(c)} \quad & \text{Reflection in } x\text{-axis means } y = -f(x). \\[2mm] & y = -\left(\frac{3}{2} \cos 2x + \frac{1}{2}\right) \\[2mm] & y = -\frac{3}{2} \cos 2x - \frac{1}{2} \quad \text{where } a = -\frac{3}{2}, b = -\frac{1}{2}. \end{aligned} \) -
Functions \(\displaystyle f\) and \(\displaystyle g\) are such that
\(\displaystyle \begin{aligned} &f(x)=2-3 \sin 2 x \text{ for } 0 \leqslant x \leqslant \pi \\[2mm] &g(x)=-2 f(x) \text{ for } 0 \leqslant x \leqslant \pi \end{aligned} \)
- State the ranges of \(\displaystyle f\) and \(\displaystyle g\).
The diagram below shows the graph of \(\displaystyle y=f(x)\).
.jpg)
- Sketch, on this diagram, the graph of \(\displaystyle y=g(x)\).
The function \(\displaystyle h\) is such that \(\displaystyle h(x)=g(x+\pi) \text{ for } -\pi \leqslant x \leqslant 0\)
- Describe fully a sequence of transformations that maps the curve \(\displaystyle y=f(x)\) onto \(\displaystyle y=h(x)\).
\(\displaystyle \begin{aligned} \textbf{(a)} \quad & \text{For } f(x) = 2 - 3 \sin 2x: \\[2mm] & \text{Max } = 2 - 3(-1) = 5, \quad \text{Min } = 2 - 3(1) = -1. \\[2mm] & \text{Range of } f: -1 \leqslant f(x) \leqslant 5 \\[2mm] & g(x) = -2f(x). \text{ So values multiply by } -2. \\[2mm] & -1 \times (-2) = 2, \quad 5 \times (-2) = -10. \\[2mm] & \text{Range of } g: -10 \leqslant g(x) \leqslant 2 \\[2mm] \textbf{(b)} \quad & \text{To sketch } y = g(x) = -2f(x) \text{:} \\[2mm] & \text{Multiply all } y\text{-coordinates of } f(x) \text{ by } -2. \\[2mm] & \text{Points to plot:} \\[2mm] & (0, 2) \to (0, -4) \\[2mm] & (\pi/4, -1) \to (\pi/4, 2) \\[2mm] & (\pi/2, 2) \to (\pi/2, -4) \\[2mm] & (3\pi/4, 5) \to (3\pi/4, -10) \\[2mm] & (\pi, 2) \to (\pi, -4) \\[2mm] \textbf{(c)} \quad & h(x) = g(x + \pi) = -2 f(x + \pi). \\[2mm] & \text{Since the period of } f(x) \text{ is } \pi \text{, } f(x+\pi) = f(x). \\[2mm] & \text{Therefore, } h(x) = -2f(x). \\[2mm] & \text{The sequence of transformations from } f(x) \text{ to } h(x) \text{ is:} \\[2mm] & \text{1. Stretch by a scale factor of 2 parallel to the } y\text{-axis.} \\[2mm] & \text{2. Reflection in the } x\text{-axis.} \end{aligned} \) -
-
- Express \(\displaystyle \frac{\tan ^{2} \theta-1}{\tan ^{2} \theta+1}\) in the form \(\displaystyle a \sin ^{2} \theta+b\), where \(\displaystyle a\) and \(\displaystyle b\) are constants to be found.
- Hence, or otherwise, and showing all necessary working, solve the equation
\(\displaystyle \frac{\tan ^{2} \theta-1}{\tan ^{2} \theta+1}=\frac{1}{4}\)
for \(\displaystyle -90^{\circ} \leqslant \theta \leqslant 0^{\circ}\)
- The diagram shows the graphs of \(\displaystyle y=\sin x\) and \(\displaystyle y=2 \cos x\) for \(\displaystyle -\pi \leqslant x \leqslant \pi\). The graphs intersect at the points \(\displaystyle A\) and \(\displaystyle B\).
- Find the \(\displaystyle x\)-coordinate of \(\displaystyle A\).
- Find the \(\displaystyle y\)-coordinate of \(\displaystyle B\).
.jpg)
\(\displaystyle \begin{aligned} \textbf{(a)(i)} \quad & \frac{\tan^2 \theta - 1}{\tan^2 \theta + 1} = \frac{\frac{\sin^2 \theta}{\cos^2 \theta} - 1}{\sec^2 \theta} \\[2mm] & = \left(\frac{\sin^2 \theta - \cos^2 \theta}{\cos^2 \theta}\right) \times \cos^2 \theta \\[2mm] & = \sin^2 \theta - \cos^2 \theta \\[2mm] & = \sin^2 \theta - (1 - \sin^2 \theta) \\[2mm] & = 2\sin^2 \theta - 1 \\[2mm] & \therefore \quad a = 2, \quad b = -1. \\[2mm] \textbf{(a)(ii)} \quad & 2\sin^2 \theta - 1 = \frac{1}{4} \\[2mm] & 2\sin^2 \theta = \frac{5}{4} \implies \sin^2 \theta = \frac{5}{8} \\[2mm] & \sin \theta = \pm \sqrt{\frac{5}{8}} \\[2mm] & \text{Since } -90^{\circ} \leqslant \theta \leqslant 0^{\circ}, \sin \theta \text{ is negative.} \\[2mm] & \sin \theta = -\sqrt{\frac{5}{8}} \implies \theta = -52.2^{\circ} \\[2mm] \textbf{(b)(i)} \quad & \text{At intersection, } \sin x = 2 \cos x \implies \tan x = 2 \\[2mm] & \text{Point } A \text{ is in the first quadrant:} \\[2mm] & x_A = \tan^{-1}(2) \approx 1.11 \text{ radians.} \\[2mm] \textbf{(b)(ii)} \quad & \text{Point } B \text{ is in the third quadrant:} \\[2mm] & x_B = \tan^{-1}(2) - \pi \approx 1.107 - 3.142 = -2.035 \text{ radians.} \\[2mm] & y_B = \sin(-2.035) \approx -0.894 \end{aligned} \) -
-
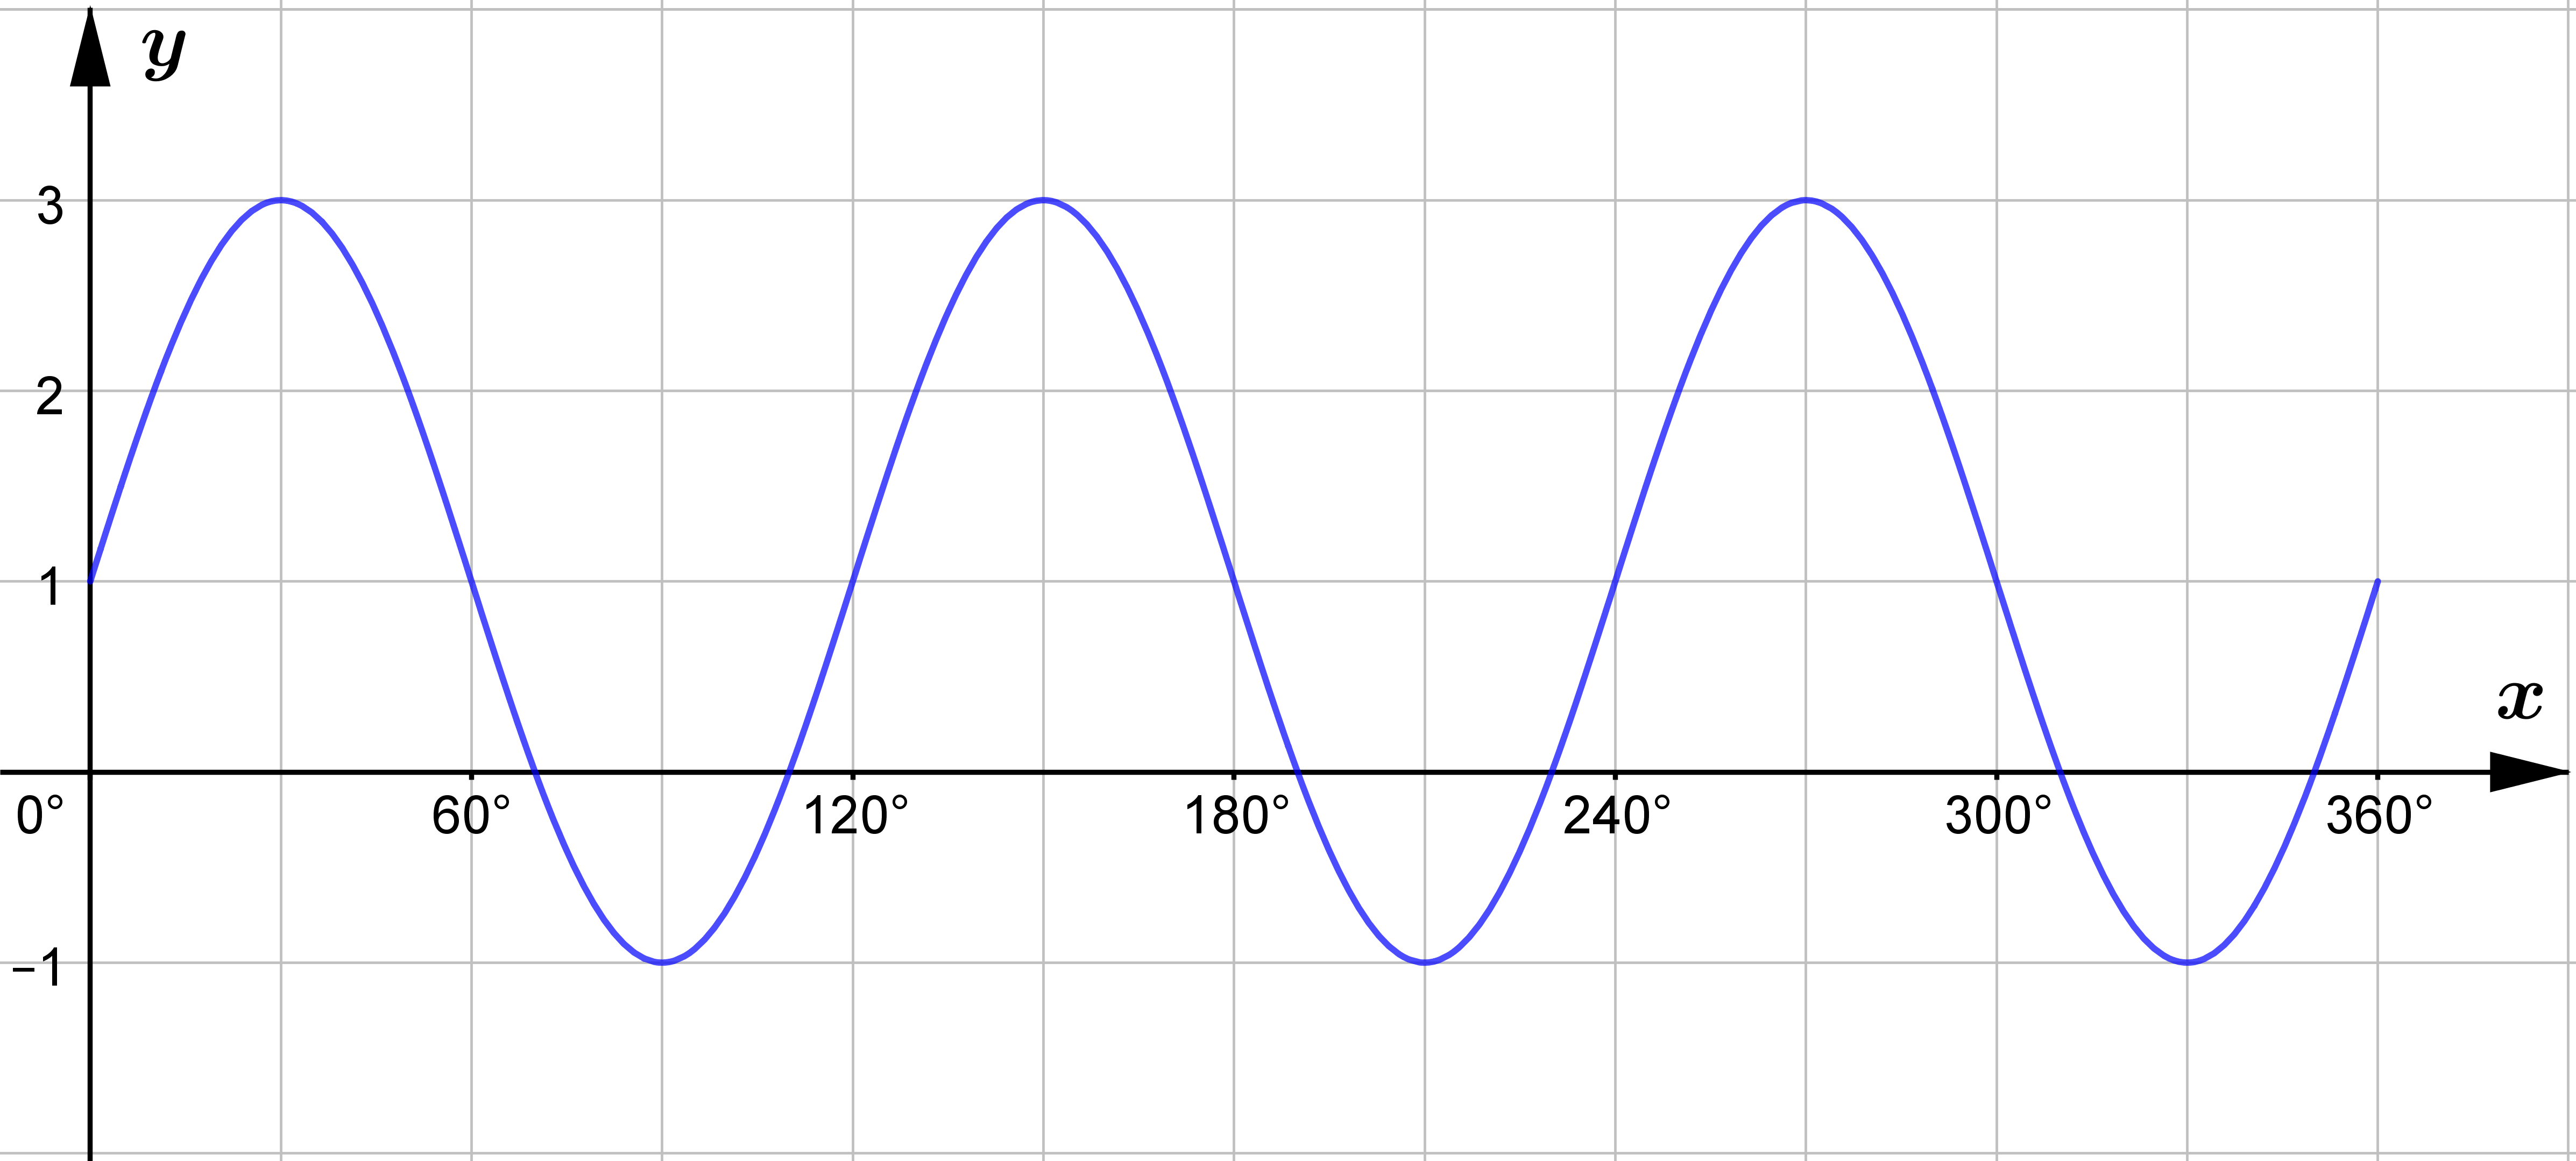
The figure above shows an accurate graph of
\(\displaystyle y=A+B \sin C x,\)
where \(\displaystyle x\) is measured in degrees and \(\displaystyle A, B\) and \(\displaystyle C\) are constants.
- State the period of the graph.
- Find the value of \(\displaystyle A, B\) and \(\displaystyle C\).
\(\displaystyle \begin{aligned} \textbf{(a)} \quad & \text{From the graph, one full cycle completes at } 120^{\circ}. \\[2mm] & \text{Period } = 120^{\circ}. \\[2mm] \textbf{(b)} \quad & \text{Maximum value } = 3, \quad \text{Minimum value } = -1. \\[2mm] & \text{Midline } A = \frac{3 + (-1)}{2} = \frac{2}{2} = 1. \\[2mm] & \text{Amplitude } B = \frac{3 - (-1)}{2} = \frac{4}{2} = 2. \\[2mm] & \text{Period } = 120^{\circ} \implies \frac{360^{\circ}}{C} = 120^{\circ} \implies C = 3. \\[2mm] & \therefore \quad A = 1, \quad B = 2, \quad C = 3. \end{aligned} \) -
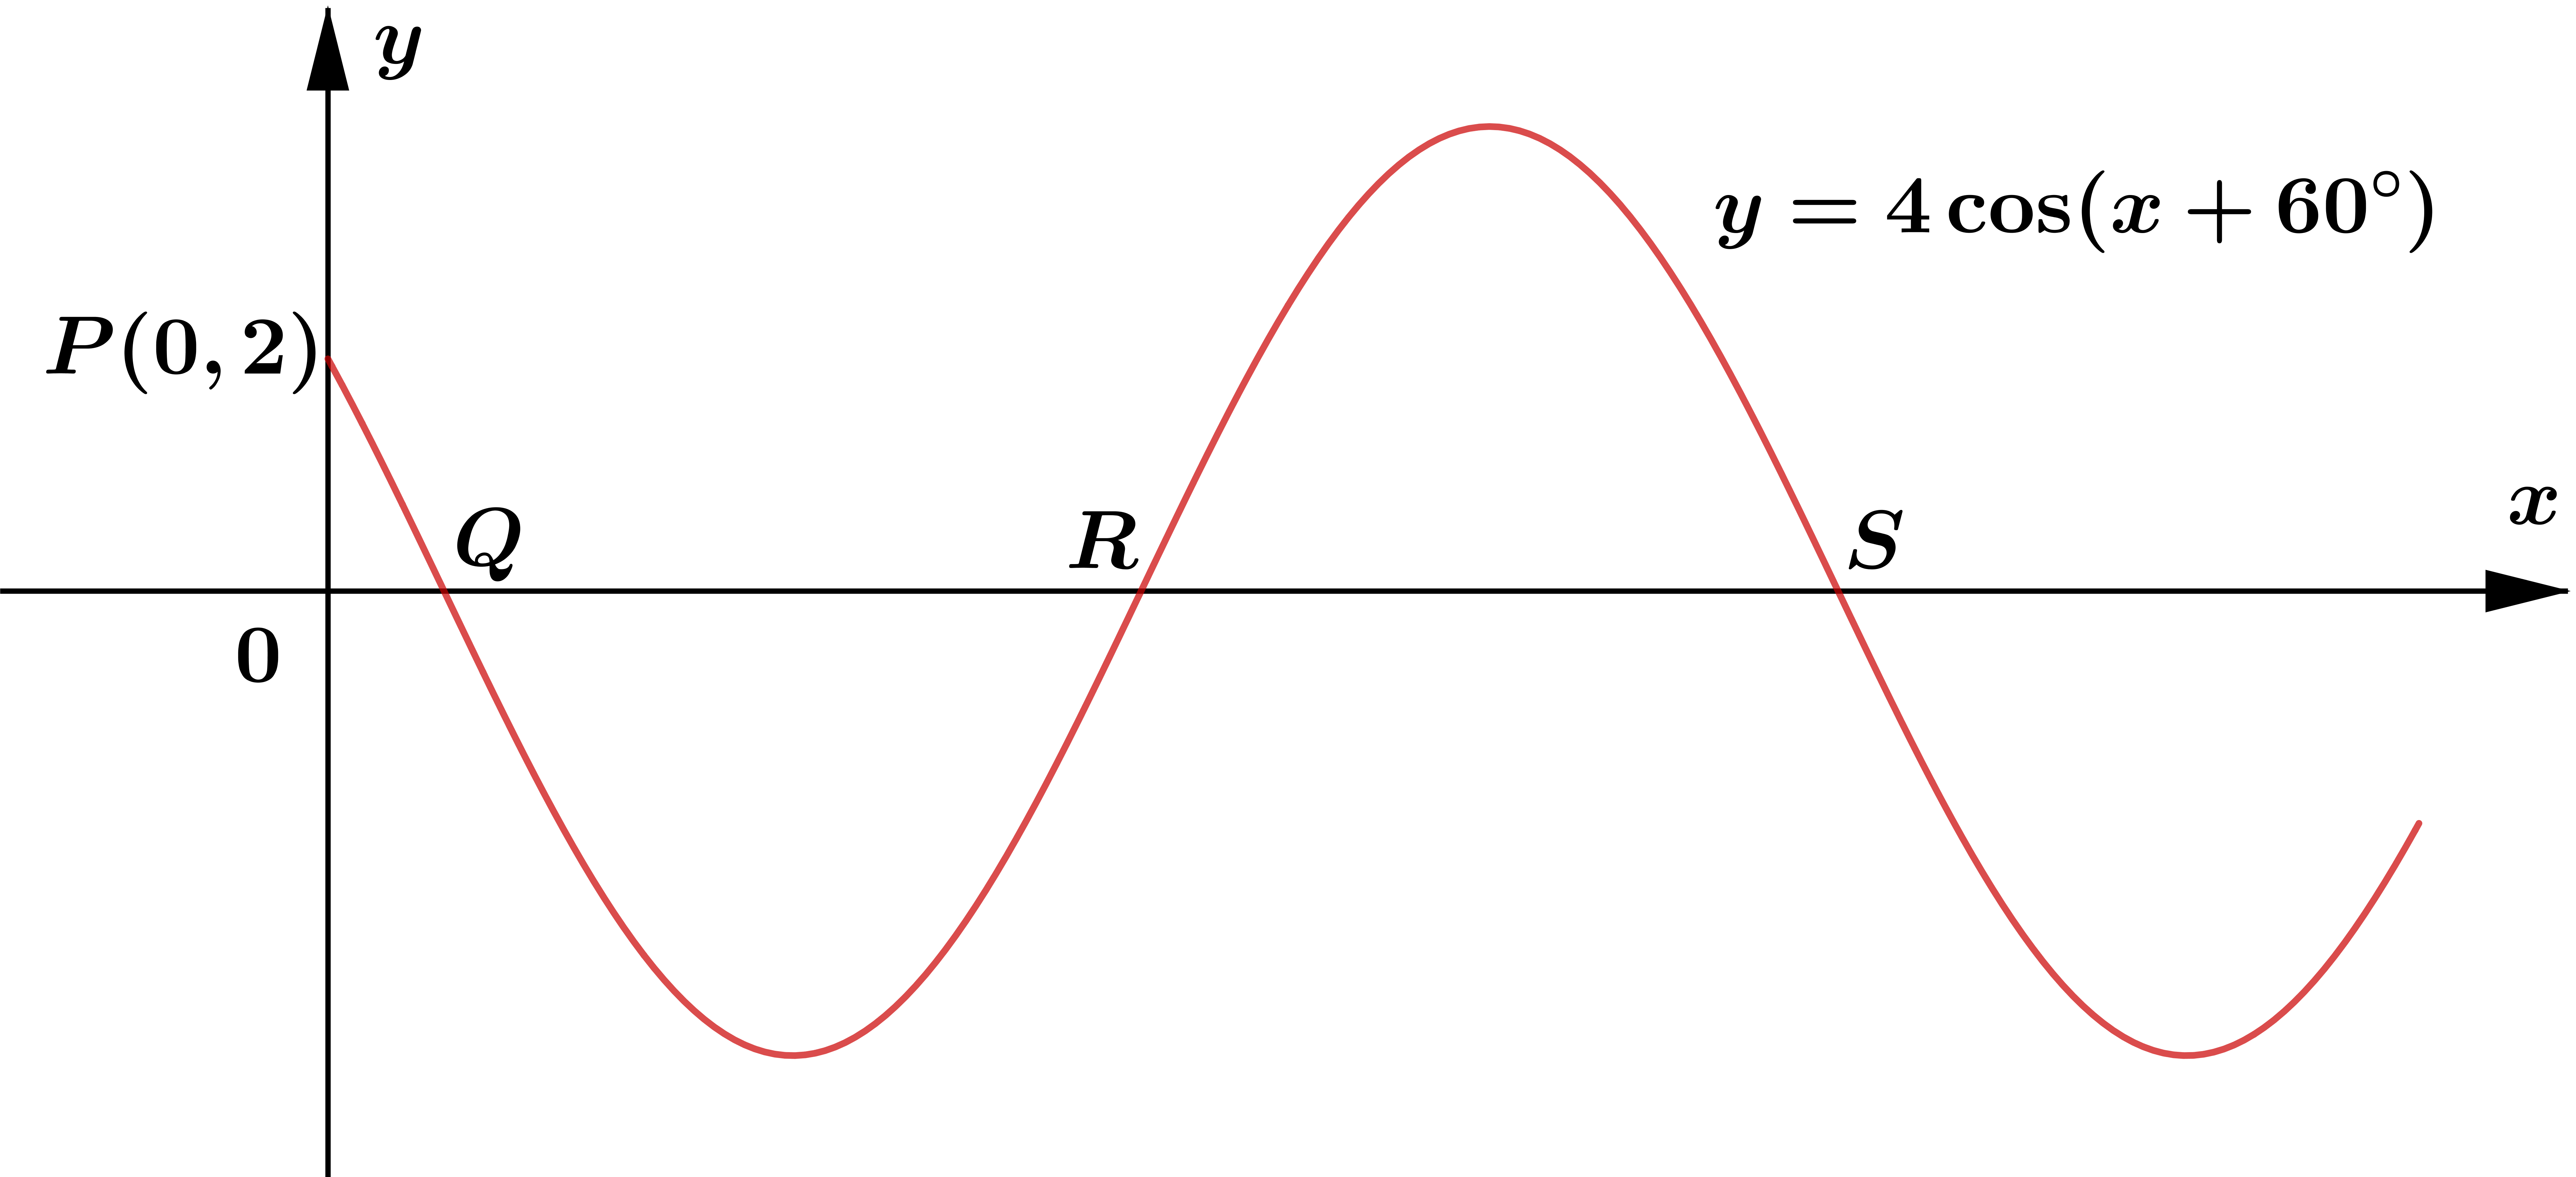
The figure above shows part of the graph of the curve with equation
\(\displaystyle y=A \cos \left(x+60^{\circ}\right),\)
where \(\displaystyle x\) is measured in degrees and \(\displaystyle A\) is a constant. The point \(\displaystyle P(0,2)\) lies on the curve.
- Find the value of \(\displaystyle A\).
The first three \(\displaystyle x\) intercepts of the curve, for which \(\displaystyle x > 0\), are the points labelled as \(\displaystyle Q, R\) and \(\displaystyle S\).
- State the coordinates of \(\displaystyle Q, R\) and \(\displaystyle S\).
\(\displaystyle \begin{aligned} \textbf{(a)} \quad & y = A \cos(x + 60^{\circ}) \\[2mm] & \text{Point } P(0, 2) \text{ lies on the curve:} \\[2mm] & 2 = A \cos(0^{\circ} + 60^{\circ}) \\[2mm] & 2 = A \left(\frac{1}{2}\right) \implies A = 4. \\[2mm] \textbf{(b)} \quad & y = 4 \cos(x + 60^{\circ}) \\[2mm] & \text{For } x\text{-intercepts, } y = 0: \\[2mm] & 4 \cos(x + 60^{\circ}) = 0 \implies \cos(x + 60^{\circ}) = 0 \\[2mm] & x + 60^{\circ} = 90^{\circ}, 270^{\circ}, 450^{\circ}, \dots \\[2mm] & x = 30^{\circ}, 210^{\circ}, 390^{\circ} \\[2mm] & \therefore \quad Q(30^{\circ}, 0), \quad R(210^{\circ}, 0), \quad S(390^{\circ}, 0). \end{aligned} \) -
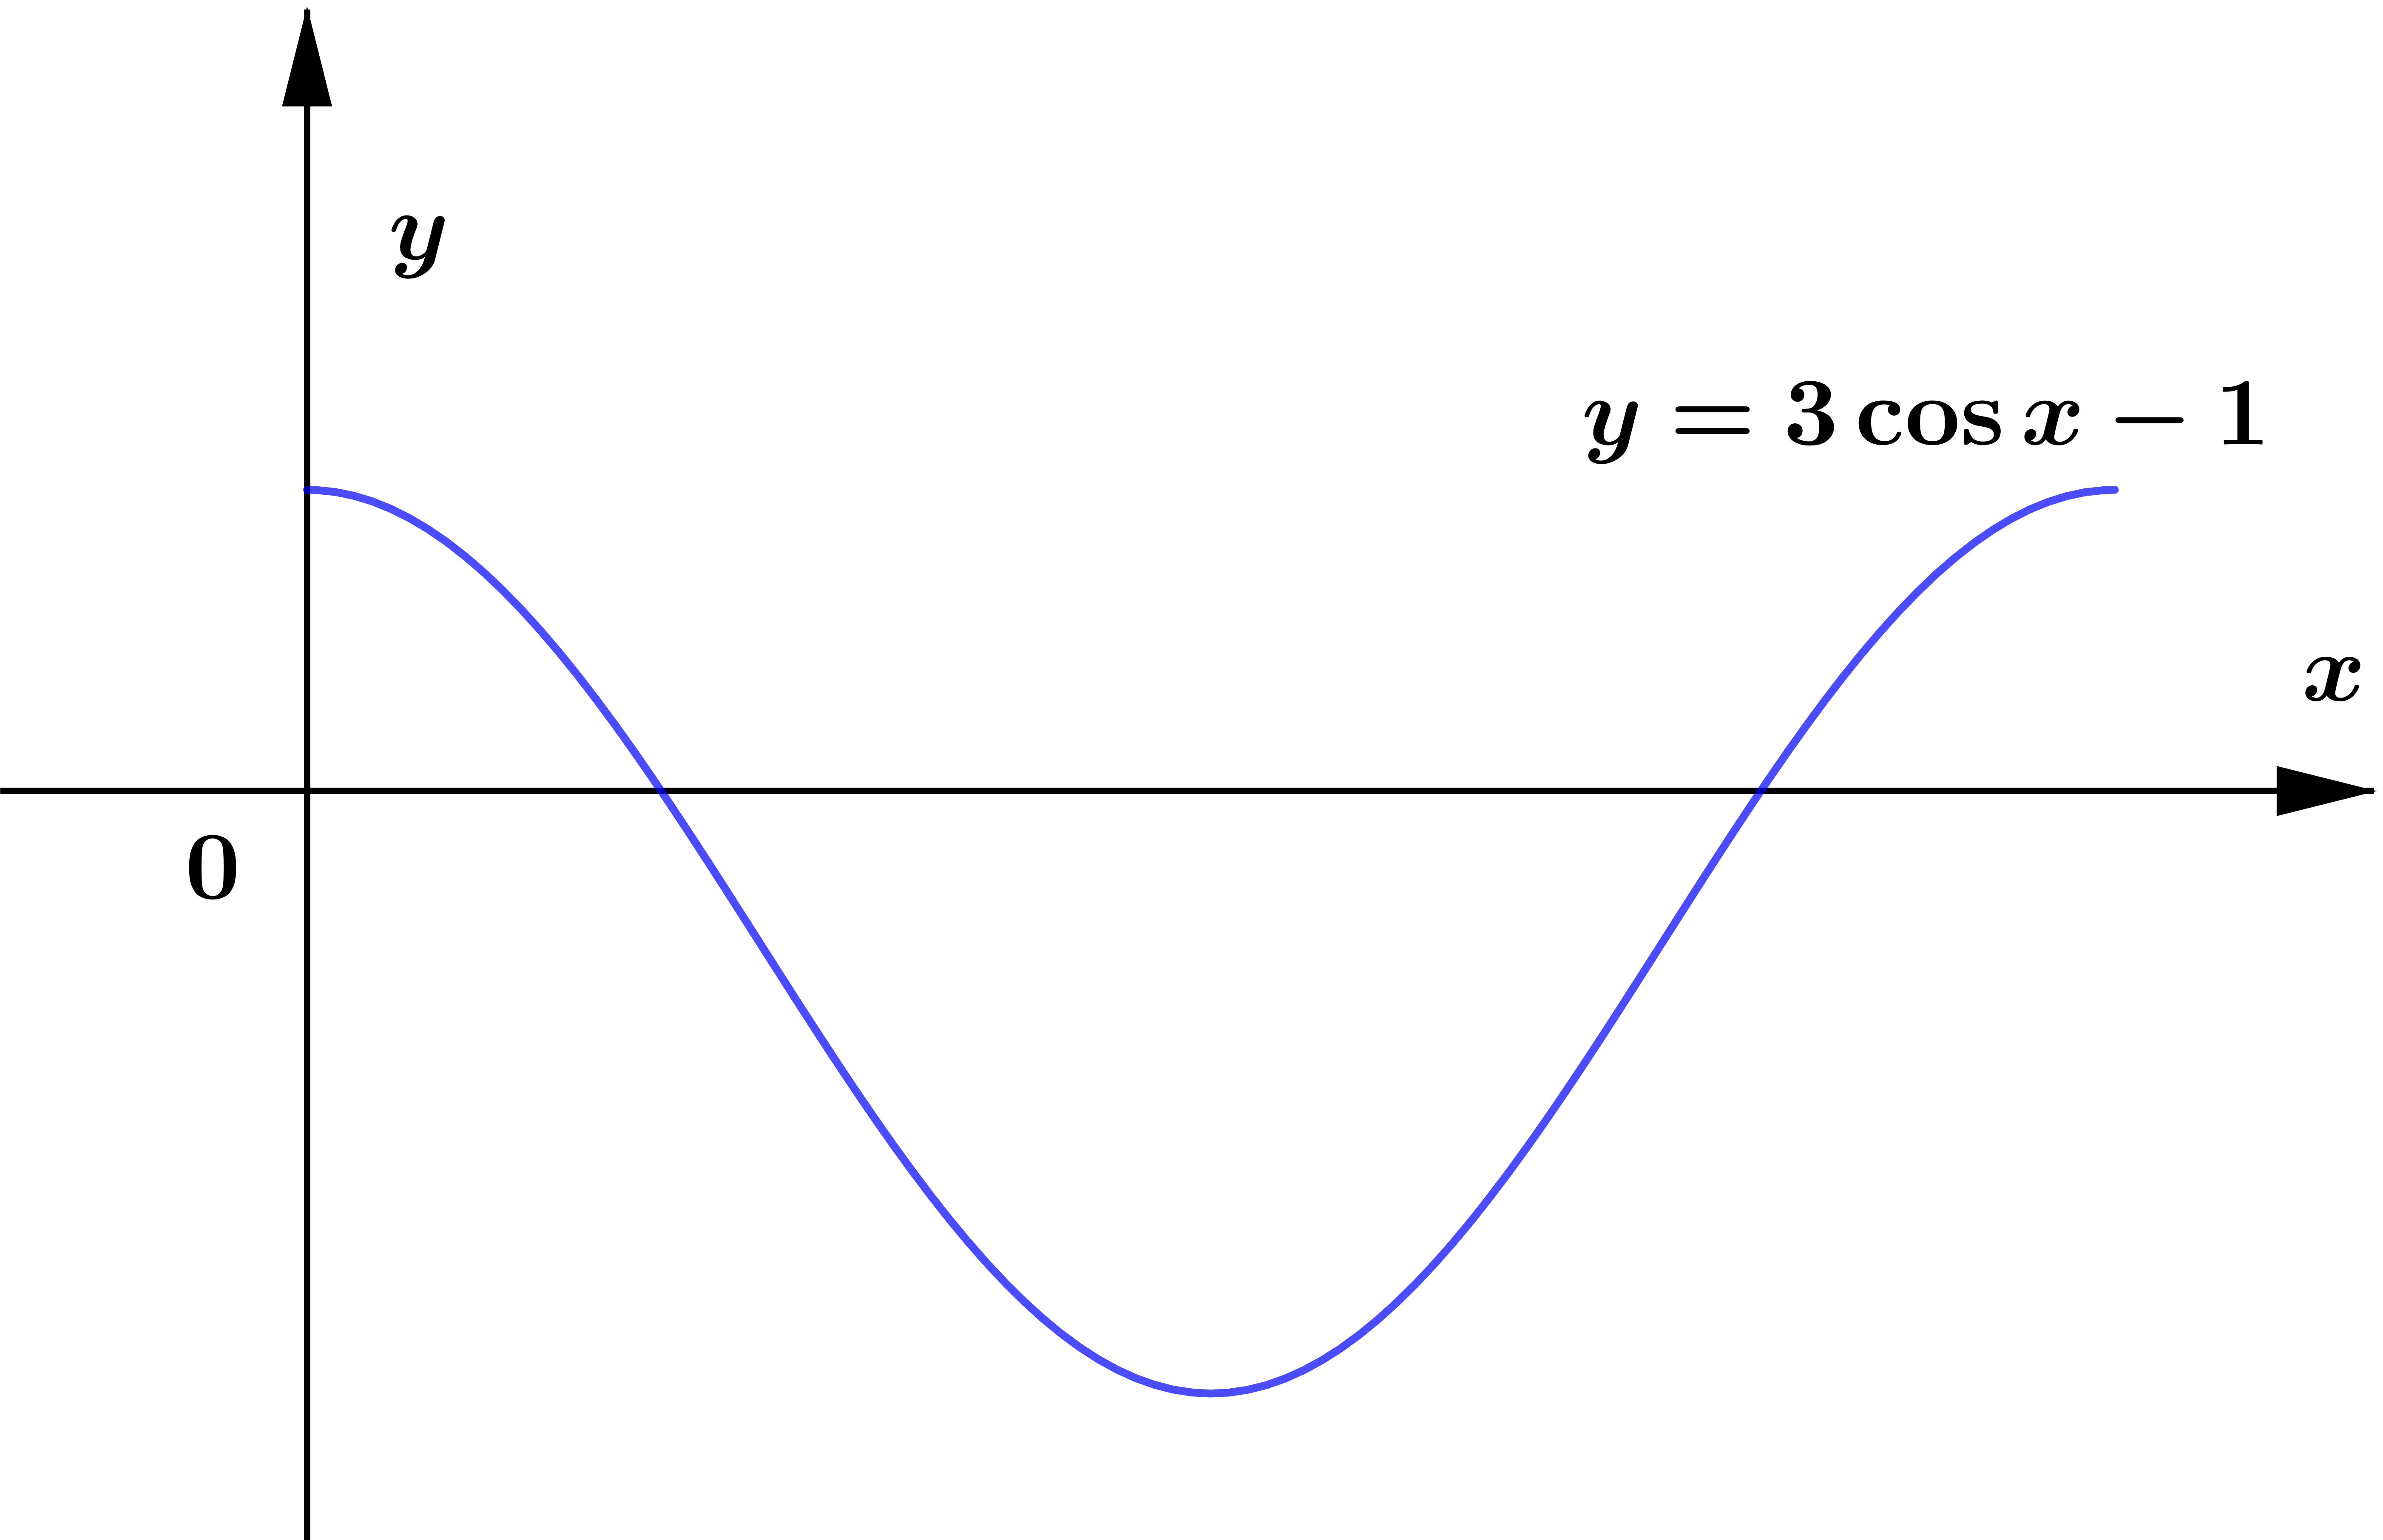
The figure above shows the graph of the curve with equation
\(\displaystyle y=3 \cos x-1, \quad 0 \leq x \leq 2 \pi .\)
The graph meets the \(\displaystyle y\) axis at point \(\displaystyle A\) and the \(\displaystyle x\) axis at points \(\displaystyle C\) and \(\displaystyle D\). The point \(\displaystyle B\) is the first minimum of the graph for which \(\displaystyle x > 0\).
- State the coordinates of \(\displaystyle A\) and \(\displaystyle B\).
- Determine the coordinates of \(\displaystyle C\) and \(\displaystyle D\), correct to three significant figures.
\(\displaystyle \begin{aligned} \textbf{(a)} \quad & \text{For point } A \text{ (y-intercept): let } x = 0. \\[2mm] & y = 3 \cos(0) - 1 = 3(1) - 1 = 2 \implies A(0, 2). \\[2mm] & \text{For point } B \text{ (minimum): } \cos x \text{ must be } -1. \\[2mm] & \cos x = -1 \implies x = \pi. \\[2mm] & y = 3(-1) - 1 = -4 \implies B(\pi, -4). \\[2mm] \textbf{(b)} \quad & \text{For points } C \text{ and } D \text{ (x-intercepts): let } y = 0. \\[2mm] & 3 \cos x - 1 = 0 \implies \cos x = \frac{1}{3}. \\[2mm] & x = \cos^{-1}\left(\frac{1}{3}\right) \approx 1.23 \text{ radians.} \\[2mm] & \text{The second solution in } 0 \le x \le 2\pi \text{ is } 2\pi - 1.23 \approx 5.05 \text{ radians.} \\[2mm] & \therefore \quad C(1.23, 0), \quad D(5.05, 0). \end{aligned} \) -
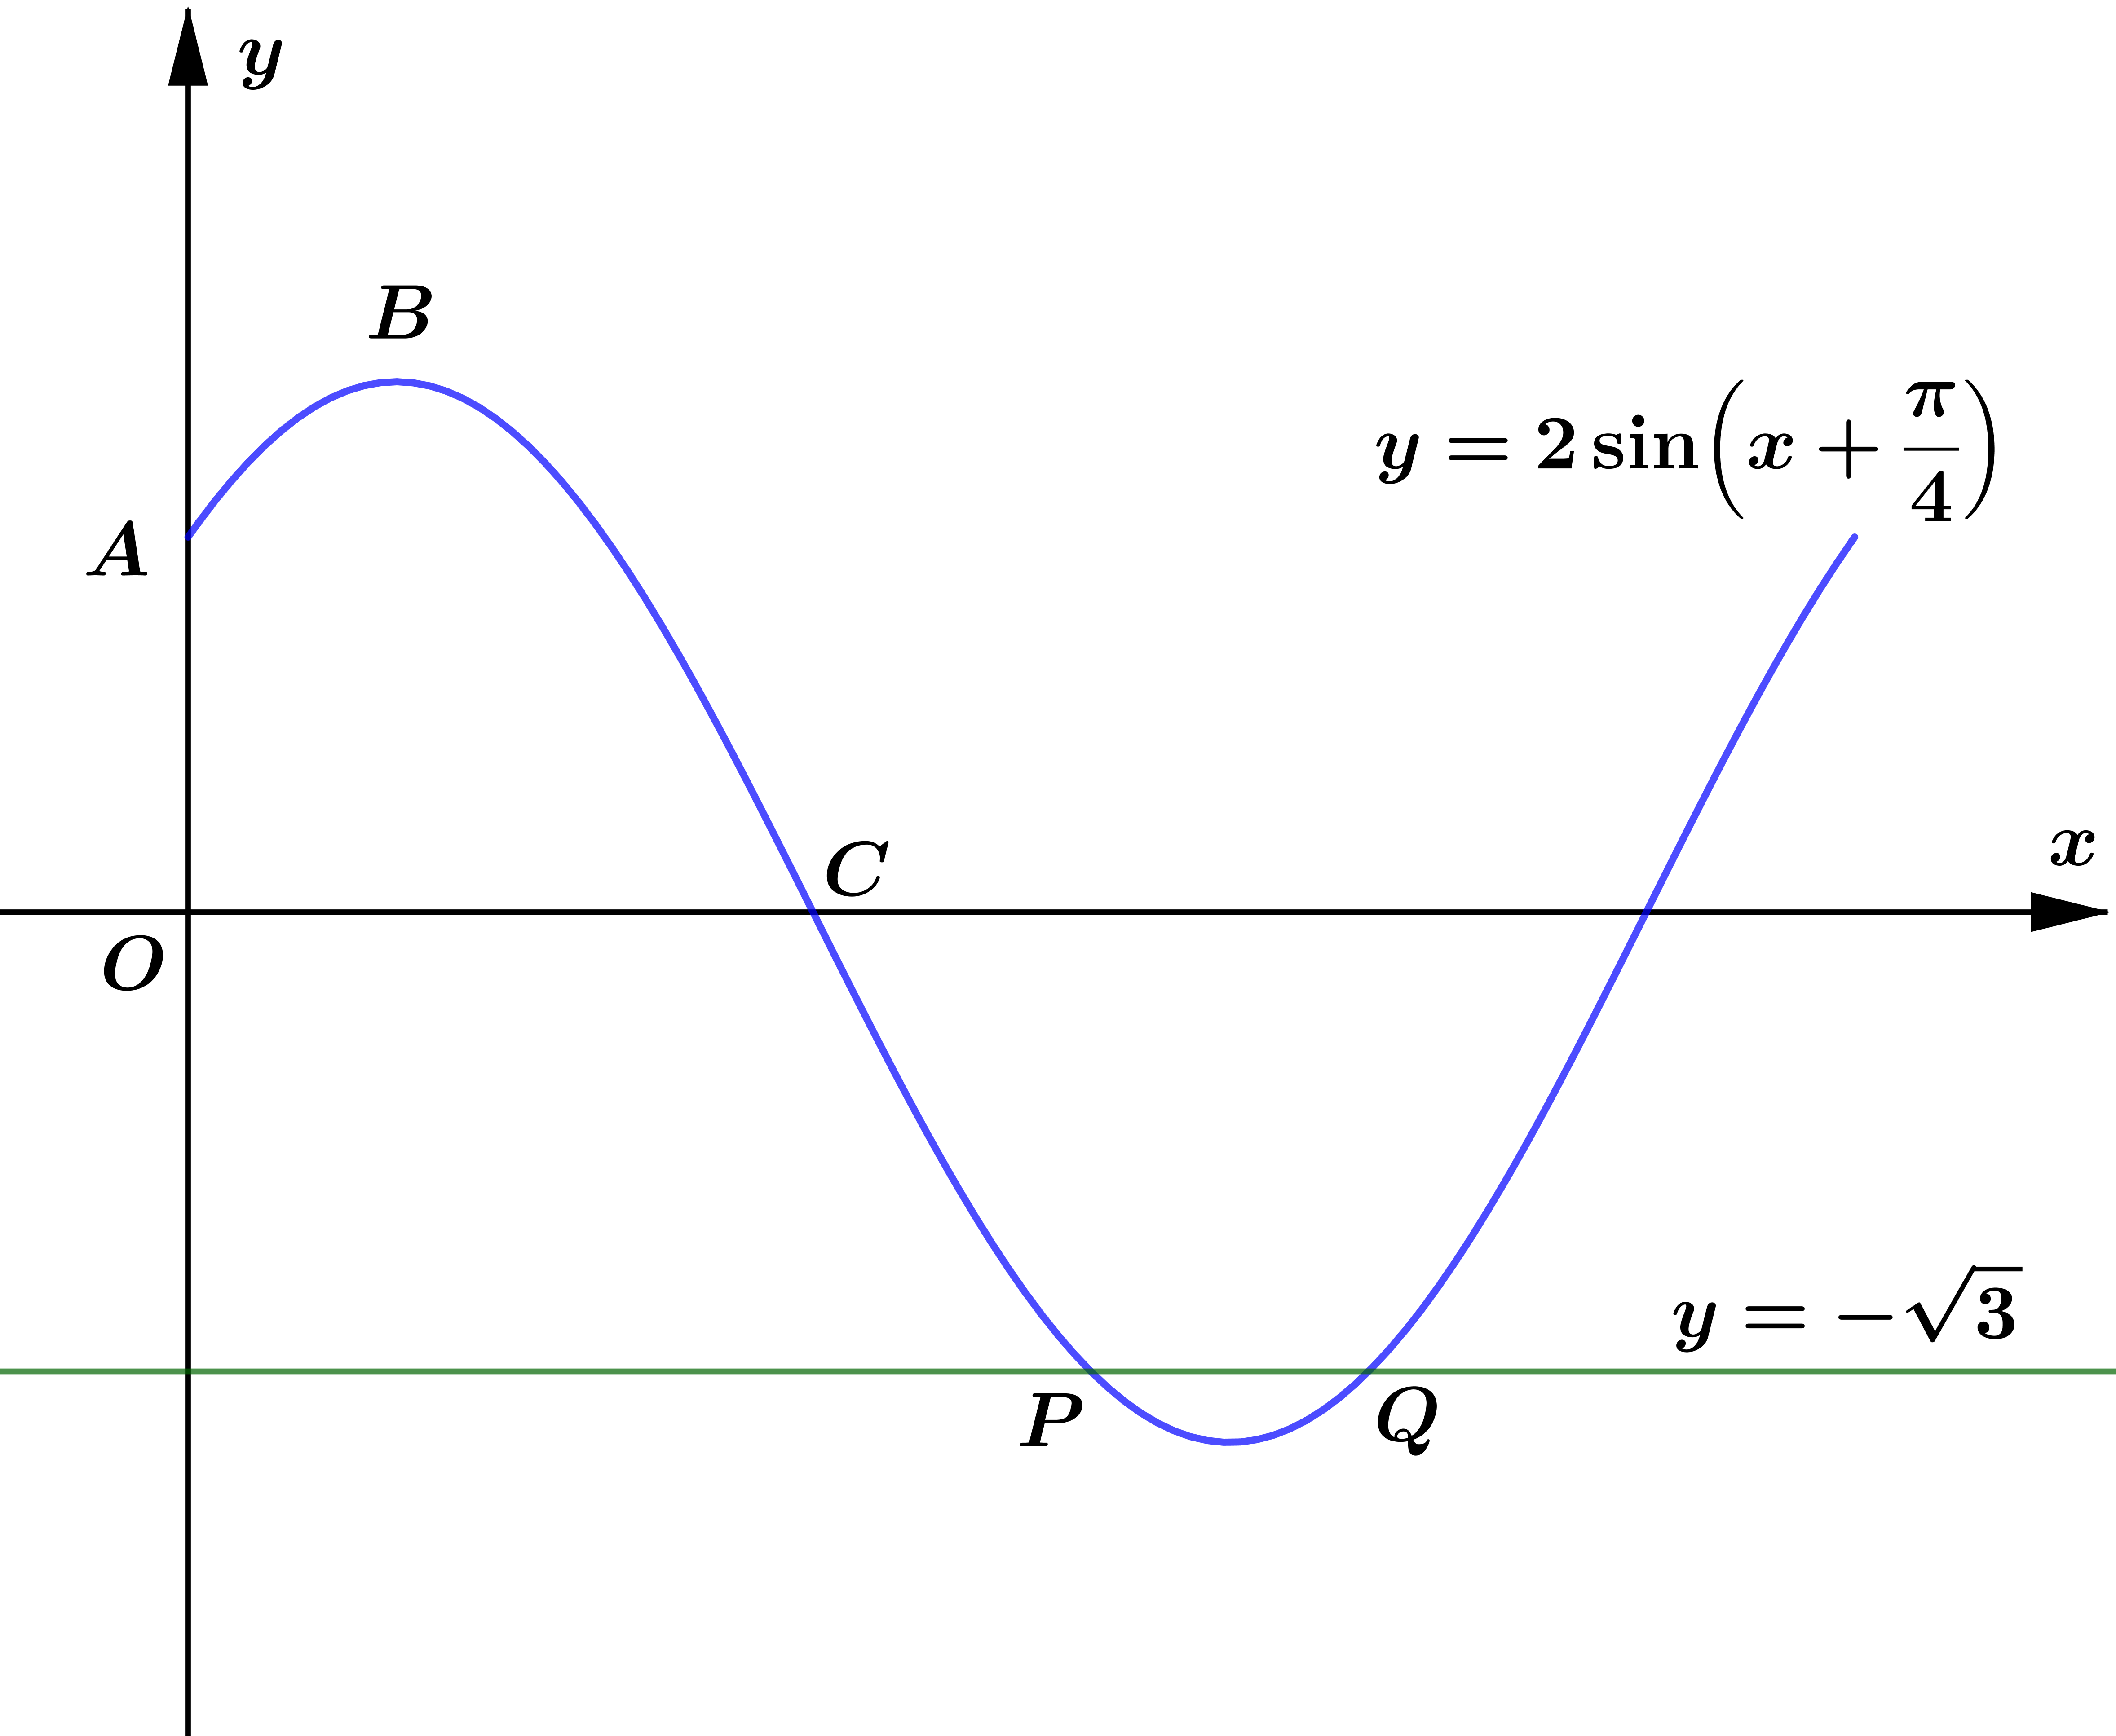
The figure above shows the graph of
\(\displaystyle y=2 \sin \left(x+\frac{\pi}{4}\right), \quad 0 \leq x \leq 2 \pi .\)
The graph meets the \(\displaystyle y\) axis at the point \(\displaystyle A\) and the point \(\displaystyle C\) is one of the two \(\displaystyle x\) intercepts of the curve. The point \(\displaystyle B\) is the maximum point of the curve.
- State the coordinates of \(\displaystyle A, B\) and \(\displaystyle C\).
The straight line with equation \(\displaystyle y=-\sqrt{3}\) meets the graph of \(\displaystyle y=2 \sin \left(x+\frac{\pi}{4}\right)\) at the points \(\displaystyle P\) and \(\displaystyle Q\).
- Determine the coordinates of \(\displaystyle P\) and \(\displaystyle Q\).
\(\displaystyle \begin{aligned} \textbf{(a)} \quad & \text{Point } A \text{ (y-intercept): } x = 0. \\[2mm] & y = 2 \sin\left(\frac{\pi}{4}\right) = 2 \left(\frac{\sqrt{2}}{2}\right) = \sqrt{2} \implies A(0, \sqrt{2}). \\[2mm] & \text{Point } B \text{ (maximum): } \sin\left(x + \frac{\pi}{4}\right) = 1. \\[2mm] & x + \frac{\pi}{4} = \frac{\pi}{2} \implies x = \frac{\pi}{4}, \quad y = 2 \implies B\left(\frac{\pi}{4}, 2\right). \\[2mm] & \text{Point } C \text{ (x-intercept): } \sin\left(x + \frac{\pi}{4}\right) = 0. \\[2mm] & x + \frac{\pi}{4} = \pi \implies x = \frac{3\pi}{4} \implies C\left(\frac{3\pi}{4}, 0\right). \quad \left(\text{Also } \frac{7\pi}{4}\right) \\[2mm] \textbf{(b)} \quad & 2 \sin\left(x + \frac{\pi}{4}\right) = -\sqrt{3} \\[2mm] & \sin\left(x + \frac{\pi}{4}\right) = -\frac{\sqrt{3}}{2} \\[2mm] & x + \frac{\pi}{4} = \pi + \frac{\pi}{3} = \frac{4\pi}{3} \quad \text{and} \quad x + \frac{\pi}{4} = 2\pi - \frac{\pi}{3} = \frac{5\pi}{3} \\[2mm] & x_P = \frac{4\pi}{3} - \frac{\pi}{4} = \frac{16\pi - 3\pi}{12} = \frac{13\pi}{12} \\[2mm] & x_Q = \frac{5\pi}{3} - \frac{\pi}{4} = \frac{20\pi - 3\pi}{12} = \frac{17\pi}{12} \\[2mm] & \therefore \quad P\left(\frac{13\pi}{12}, -\sqrt{3}\right), \quad Q\left(\frac{17\pi}{12}, -\sqrt{3}\right). \end{aligned} \)
Post a Comment